Tcpdump is a packet capture tool used for network troubleshooting. It is imported into Wireshark for packet analysis and to pinpoint the root cause of network problems. Tcpdump is often used by Network Engineers to confirm “It’s not the network” when troubleshooting network and application problems with developers. In fact, anecdotal evidence suggests the network is responsible for only 25-35% of all problems. The root cause of most errors is at the application layer.
Wireshark Labs
- Lab 1: Linux UFW Firewall
- Lab 2: Cisco ACL/Firewall
- Lab 3: TCP Connection Refused
- Lab 4: SSL/TLS Certificate Error
- Lab 5: HTTP 400 Bad Request
- Lab 6: HTTP 404 Not Found
- Lab 7: DNS Name Not Resolved
- Lab 8: DNS Connection Timed Out
- Lab 9: HTTP 504 Gateway Timeout
Install Cisco CML Free Version Software
Cisco CML install is required for all Wireshark/tcpdump labs. The article also explains how to install VMware (free) and configure the correct DHCP subnet using virtual editor. Cisco CML provides access to existing automation labs along with other labs available here.
Cisco CML Free Version Install
Configure Port Forwarding
VMware port forwarding enables connection between Windows 11 host machine and CML VM lab. This is required to copy files from web server or client to Windows home directory for Wireshark analysis.
Select VMware Edit menu -> Virtual Network Editor -> Change Settings -> VMnet8 -> NAT settings
Port Forwarding -> Add (server capture)
Host port: 8000
Type: TCP
VM IP address: 192.168.200.1
VM port: 8000
Port Forwarding -> Add (client capture)
Host port: 8001
Type: TCP
VM IP address: 192.168.10.1
VM port: 8001
Lab Setup and Software Install
The following instructions apply to initial lab setup only so that software is installed on Ubuntu nodes. Keep your laptop plugged in at all times when running labs for best performance and follow instructions in the correct order.
Step 1: Access CML UI from your browser with DHCP assigned IP address shown in the CML VM console (ignore 9090). Select Advanced button to ignore any SSL certificate warnings, and select Proceed.
This command is an example with CML default username admin and password you created when installing CML. The assigned IP address is only an example and could be different.
https://192.168.216.129
Username: admin
Password: **********
Step 2: Download the wireshark lab (.yaml) provided with each lab. Select CML Import then browse to your downloads directory. Select CML wireshark lab and select import into CML.
Step 3: Start Internet node and Cisco devices manually first with right-click start option. Wait for green check mark to appear for all nodes. Repeat steps for each lab separately when you first start lab.
Step 4: Start Ubuntu client node manually with right-click start option. Monitor install from console and wait for cloud-init to finish. The initial install will take approximately 1-2 minutes to configure IP addressing on Ubuntu client.
[ OK ] Finished cloud-final.service – Cloud-init: Final Stage.
[ OK ] Reached target cloud-init.target – Cloud-init target.
Hit Enter for login
username: cisco
password: cisco
Step 5: Start Ubuntu server node only after Ubuntu client is finished. Monitor install from console and wait for cloud-init to finish. The initial install will take approximately 3-4 minutes to configure IP addressing, update packages, and install Nginx with SSL certificate on Ubuntu server.
[ OK ] Finished cloud-final.service – Cloud-init: Final Stage.
[ OK ] Reached target cloud-init.target – Cloud-init target.
Hit Enter for login
username: cisco
password: cisco
Step 6: Select LAB menu item from top of workspace and click stop lab after login to client and server.
*Restart CML VM on slower machines (8 GB RAM) after install since labs have Ubuntu nodes. This is done only once to reset Ubuntu nodes after install and enable caching of disk images for faster performance.
*CML VM disables automatic launch of all nodes when CPU overutilization occurs on slower machines (8 GB RAM). Right-click to start any node manually if green check mark does not appear within 1-2 minutes.
Lab 1: Linux UFW Firewall
Incident Report
Browser hangs for several seconds when connecting to https://webserver.com and returns ERR_CONNECTION_TIMED_OUT.
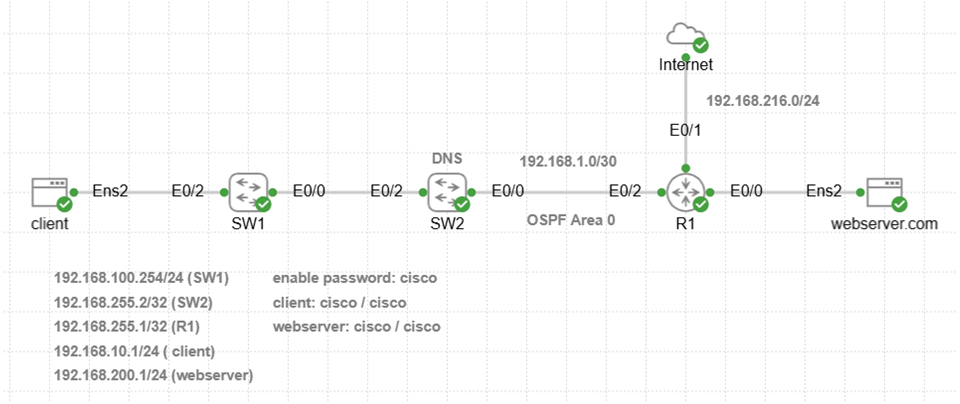
Ping Network Connection Test
Verify there is network connectivity with ping test from client to web server.
ping -c 10 192.168.200.1
PING 192.168.200.1 (192.168.200.1) 56(84) bytes of data.
— 192.168.200.1 ping statistics —
10 packets transmitted, 10 received, 0% packet loss, time 9019ms
rtt min/avg/max/mdev = 3.217/5.820/8.009/1.265 ms
Tcpdump Server-Side Capture
Copy and paste tcpdump command to web server to capture traffic with source or destination IP address of client. Tcpdump will only capture packets with TCP source or destination port 443.
Tcpdump Command Options:
-i ens2 = capture packets on local Ethernet interface ens2
-nn = do not resolve hostnames or ports (show IP and port numbers)
-s0 = capture entire packet to prevent truncation
-w = save capture (.pcap) to filename for import to Wireshark
clear
sudo tcpdump -i ens2 -nn -s0 -w lab1_server_https.pcap host 192.168.10.1 and tcp port 443
Generate Application Traffic
The purpose of curl is to simulate a web browser connection to generate application layer traffic for capture (.pcap) file. This curl command tests HTTPS application connection to web server and only returns response headers (-I). Copy and paste curl command to client to simulate browser connection to web server.
cURL Troubleshooting Commands:
-I = http response headers only (no HTML body)
–connect-timeout = wait time for connection
-v = verbose mode for troubleshooting
--connect-timeout 10 https://192.168.200.1 -v
The results indicate connection timeout to web server after 10 seconds. This error often occurs when a firewall rule or ACL filter is dropping packets. It is recommended to use connect-timeout parameter since curl command will wait for connection indefinitely.
Trying 192.168.200.1:443…
ipv4 connect timeout after 10000ms, move on!
Failed to connect to 192.168.200.1 port 443 after 10003 ms: Timeout was reached
Closing connection
curl: (28) Failed to connect to 192.168.200.1 port 443 after 10003 ms: Timeout was reached
Ctrl + C to stop tcpdump capture on web server.
Copy Capture File to Windows Directory
Type this command on web server to start Python HTTP server listening on TCP port 8000. This enables copying of capture file from web server to Windows home directory.
python3 -m http.server 8000
Open Windows CMD prompt and copy capture file (.pcap) using curl from web server to Windows User directory for wireshark analysis.
curl -O http://localhost:8000/lab1_server_https.pcap
Ctrl + C to exit from Python HTTP server.
Wireshark Import
Wireshark Expert Information provides a summary of errors indentified in the trace such as retransmissions and other errors. TCP retransmissions are normal however when they occur with TCP handshake that indicates a network error.
File -> Open -> Navigate to C:\Users\<username>\lab1_server_https.pcap
Analyze -> Expert Information -> retransmission events -> close box
Wireshark Display Filters
Display filters are used to create a subset view of only errors and other packets relevant for troubleshooting purposes. Normally a packet capture on a web server would have packets from multiple different connected users. The labs here do not need a display filter since packets are limited to a single curl connection. The example provided here is for reference only when filtering a real-world capture file.
Go to ‘apply a display filter’ box below menu items and enter this filter to view only initial TCP handshake SYN packets retranmitted. This confirms there is a problem with TCP handshake connection to web server. Configure optional coloring to automatically highlight only TCP retransmissions from initial TCP handshake.
tcp.analysis.retransmission && tcp.flags.syn == 1
Wireshark Trace Analysis
Repeated SYN packets are sent from client to web server shown as TCP retransmissions. The server did not send SYN-ACK to client as part of TCP handshake.
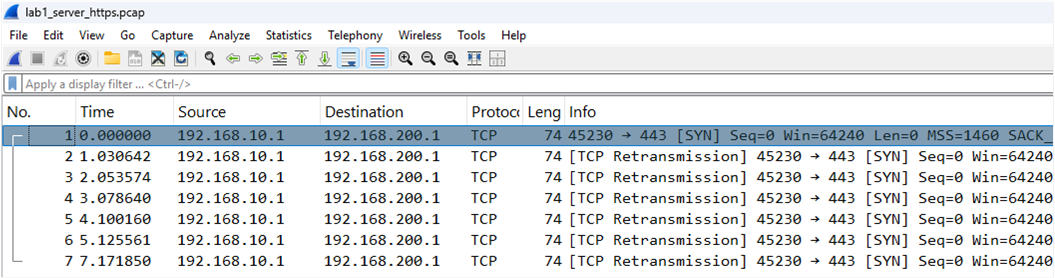
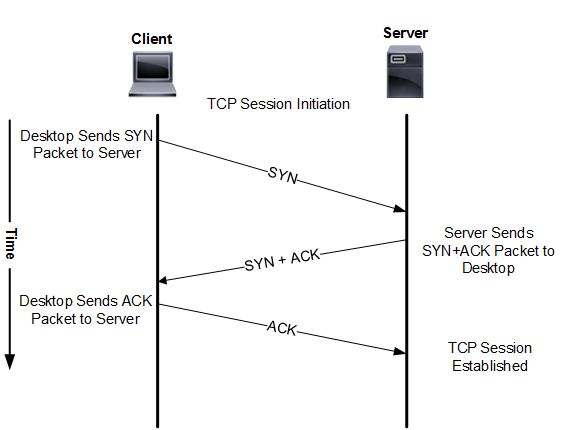
Explanation
TCP handshake starts with SYN packet sent from client to web server with destination port 443.
SYN packets arrive at web server so there is no Cisco firewall or ACL blocking port 443.
Client never receives SYN-ACK from web server and TCP handshake fails.
Client sends repeated TCP SYN packets and server firewall silent drops them.
There are no SSL/TLS handshake or GET request packets since TCP handshake failed .
TCP handshake -> SSL/TLS handshake -> HTTP GET request
Display the firewall rules on Ubuntu server to verify whether port 443 is denied and delete existing rule.
sudo ufw status verbose
Ubuntu server firewall has a rule that is denying TCP port 443. SYN packet sent with TCP handshake has TCP destination port 443 and that prevents connection to server.
sudo ufw status numbered
sudo ufw delete 1
sudo ufw allow 443
Confirm that HTTPS connection from client to web server is working correctly. The original browser error however did not indicate any problem with DNS resolution. The second curl command includes verbode mode to display details on TCP and SSL handshake for reference.
curl -I https://webserver.com
curl -I https://webserver.com -v
Host webserver.com:443 was resolved.
IPv6: (none)
IPv4: 192.168.200.1
Trying 192.168.200.1:443...
Connected to webserver.com (192.168.200.1) port 443

SSL connection using TLSv1.3 / TLS_AES_256_GCM_SHA384 / X25519 / RSASSA-PSS
ALPN: server accepted http/1.1
Server certificate:
subject: C=US; ST=State; L=City; O=CISCONET; OU=IT; CN=webserver.com
start date: Feb 26 22:36:15 2026 GMT
expire date: Feb  2 22:36:15 2126 GMT
common name: webserver.com (matched)
issuer: C=US; ST=State; L=City; O=CISCONET; OU=IT; CN=webserver.com
SSL certificate verify ok.

Host: webserver.com

HTTP/1.1 200 OK
Server: nginx/1.24.0 (Ubuntu)
Connection #0 to host webserver.com left intact
Lab 2: Cisco ACL/Firewall
Incident Report
Browser hangs for several seconds when connecting to https://webserver.com and returns ERR_CONNECTION_TIMED_OUT.

Ping Network Connection Test
Verify there is network connectivity with ping test from client to web server.
ping -c 10 192.168.200.1
PING 192.168.200.1 (192.168.200.1) 56(84) bytes of data.
— 192.168.200.1 ping statistics —
10 packets transmitted, 10 received, 0% packet loss, time 9020ms
rtt min/avg/max/mdev = 4.774/6.674/9.408/1.185 ms
Tcpdump Server-Side Capture
Copy and paste tcpdump command to web server to capture traffic with source or destination IP address of client. Tcpdump will only capture packets with TCP source or destination port 443.
sudo tcpdump -i ens2 -nn -s0 -w lab2_server_https.pcap host 192.168.10.1 and tcp port 443
Generate Application Traffic
This curl command tests HTTPS application connection to web server and only returns response headers (-I). Copy and paste curl command to client to simulate browser connection to web server.
curl -I --connect-timeout 10 https://webserver.com -v
The results indicate connection failure to web server was almost immediate. The curl command interpreted this connection error as No route to host. This suggests a network connection issue however ping worked so this is misleading. Cisco devices will return ICMP unreachable network error for example when packet cannot be forwarded for some reason.
Host webserver.com:443 was resolved.
IPv6: (none)
IPv4: 192.168.200.1
Trying 192.168.200.1:443...
connect to 192.168.200.1 port 443 from 192.168.10.1 port 53974 failed: No route to host
Failed to connect to webserver.com port 443 after 137 ms: Couldn't connect to server
Closing connection
curl: (7) Failed to connect to webserver.com port 443 after 137 ms: Couldn't connect to server
Ctrl + C to stop tcpdump capture on web server.
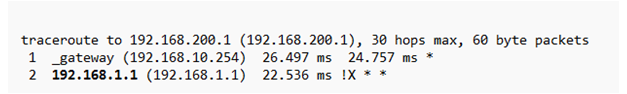
Run traceroute on client to verify routing path to web server and identify where packets are dropped. Traceroute command sends TCP packets (-T) to port 443 for application layer diagnostics. The results confirm packets sent to web server TCP port 443 are dropped at 192.168.1.1 (R1 interface E0/2). Traceroute !X * * error suggests that packet filtering is preventing communication with the web server.
sudo traceroute 192.168.200.1 -T -p 443
Copy Capture File to Windows Directory
Type this command on web server to start Python HTTP server listening on TCP port 8000. This enables copying of capture file from web server to Windows home directory.
python3 -m http.server 8000
Open Windows CMD prompt and copy capture file (.pcap) using curl from web server to Windows User directory for wireshark analysis.
curl -O http://localhost:8000/lab2_server_https.pcap
Ctrl + C to exit from Python HTTP server.
Wireshark Import
File -> Open -> Navigate to C:\Users\<username>\lab2_server_https.pcap
Packet trace is empty.
Wireshark Trace Analysis
The server-side trace is empty since packets never arrive and client-side capture will be required. You will open two bash windows on client to run simultaneous tcpdump and curl command with & operator.
Tcpdump Client-Side Capture
Copy and paste tcpdump command to client to capture traffic with source or destination IP address of web server. Tcpdump will only capture packets with TCP source or destination port 443. The & operator will run tcpdump capture in the background so that curl command can be run in foreground.
sudo tcpdump -i ens2 -nn -s0 -w lab2_client_https.pcap host 192.168.200.1 and tcp port 443 &
Generate Application Traffic
This curl command tests HTTPS application connection to web server and only returns response headers (-I). Copy and paste curl command to client to simulate browser connection to web server.
curl -I --connect-timeout 10 https://webserver.com -v
Host webserver.com:443 was resolved.
IPv6: (none)
IPv4: 192.168.200.1
Trying 192.168.200.1:443...
connect to 192.168.200.1 port 443 from 192.168.10.1 port 38646 failed: No route to host
Failed to connect to webserver.com port 443 after 539 ms: Couldn't connect to server
Closing connection
curl: (7) Failed to connect to webserver.com port 443 after 539 ms: Couldn't connect to server
Stop tcpdump capture running in the background on client with this command.
sudo pkill tcpdump
Copy Capture File to Windows Directory
Copy and paste this command on client to start Python HTTP server listening on TCP port 8001. This enables copy of capture file from client to Windows home directory.
python3 -m http.server 8001
Open Windows CMD prompt and copy capture file (.pcap) using curl from client to Windows User directory for wireshark analysis.
curl -O http://localhost:8001/lab2_client_https.pcap
Ctrl + C to exit from Python HTTP server.
Wireshark Import
File -> Open -> Navigate to C:\Users\<username>\lab2_client_https.pcap
Wireshark Display Filter
Go to ‘apply a display filter’ box below menu items and enter a filter.
tcp.analysis.retransmission && tcp.flags.syn == 1
Wireshark Trace Analysis
Client starts TCP handshake and sends only the initial SYN packet to web server. There is no SYN-ACK response from web server. Select and open TCP protocol details in main window and there is Incomplete, SYN_Sent (1) error.
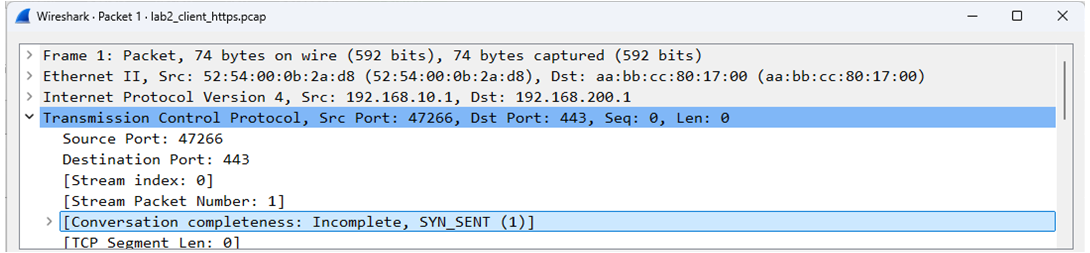
Explanation
TCP handshake starts with SYN packet sent from client that has TCP destination port 443.
SYN packet is dropped since each packet has TCP destination port 443.
Client never receives SYN-ACK from server to complete TCP handshake.
TCP handshake -> SSL/TLS handshake -> HTTP GET request
Since there are no packets in server-side capture, the problem is not at the web server. Traceroute results confirm packets were being dropped at R1. Display all Cisco access control lists (ACL) on R1 with the following Cisco IOS show command.
R1#show access-lists
Remove ACL 100 from interface E0/2 inbound with the following Cisco configuration commands.
interface E0/2
no ip access-group 100 in
end
Confirm that HTTPS connection from client to web server is working correctly.
curl -I https://webserver.com -v
Lab 3: TCP Connection Refused (RST)
Incident Report
Browser hangs for several seconds when connecting to https://webserver.com and returns ERR_CONNECTION_REFUSED.

Ping Network Connection Test
Verify there is network connectivity with ping test from client to web server.
ping -c 10 192.168.200.1
PING 192.168.200.1 (192.168.200.1) 56(84) bytes of data.
— 192.168.200.1 ping statistics —
10 packets transmitted, 10 received, 0% packet loss, time 9019ms
rtt min/avg/max/mdev = 3.603/6.200/7.532/1.009 ms
Tcpdump Server-Side Capture
Copy and paste tcpdump command to web server to capture all traffic with source or destination IP address of client. Tcpdump will only capture packets with TCP source or destination port 443.
sudo tcpdump -i ens2 -nn -s0 -w lab3_server_https.pcap host 192.168.10.1 and tcp port 443
Generate Application Traffic
This curl command tests HTTPS application connection to web server and only returns response headers (-I). Copy and paste curl command to client to simulate browser connection to web server.
curl -I --connect-timeout 10 https://webserver.com -v
The results indicate connection failure to web server was almost immediate. The curl command interpreted this as TCP connection refused error. This suggests packets made it to the web server and were dropped for some reason.
Host webserver.com:443 was resolved.
IPv6: (none)
IPv4: 192.168.200.1
Trying 192.168.200.1:443...
connect to 192.168.200.1 port 443 from 192.168.10.1 port 38726 failed: Connection refused
Failed to connect to webserver.com port 443 after 8028 ms: Couldn't connect to server
Closing connection
curl: (7) Failed to connect to webserver.com port 443 after 8028 ms: Couldn't connect to server
Ctrl + C to stop tcpdump capture on server.
Copy Capture File to Windows Directory
Type this command on web server to start Python HTTP server listening on TCP port 8000. This enables copying of capture file from web server to Windows home directory.
python3 -m http.server 8000
Open Windows CMD prompt and copy capture file (.pcap) using curl from web server to Windows User directory for wireshark analysis.
curl -O http://localhost:8000/lab3_server_https.pcap
Ctrl + C to exit from Python HTTP server.
Wireshark Import
File -> Open -> Navigate to C:\Users\<username>\lab3_server_https.pcap
Wireshark Display Filter
Go to ‘apply a display filter’ box below menu items and enter a filter.
tcp.flags
Wireshark Trace Analysis
Client sends SYN packet and web server returns TCP reset (RST) packet to client. This is an application layer issue where web server is refusing connection. There are a variety of root causes such as TCP listening port 443 closed, application crash, or server busy.
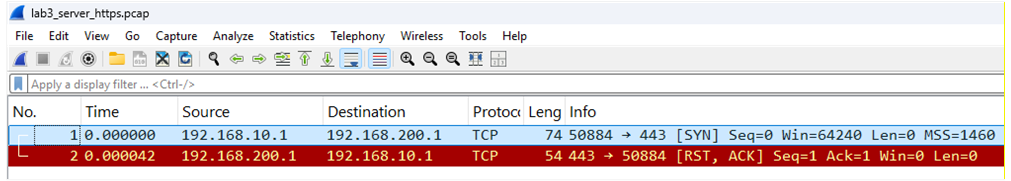
Explanation
TCP handshake starts with SYN packet sent from client with destination port 443.
SYN packet arrives at server so there is no Cisco firewall or ACL blocking port 443.
Web server sends RST packet to client that terminates connection.
DNS query -> TCP handshake -> SSL/TLS handshake -> HTTP GET request
Verify that Nginx web service is installed and running on web server with this Linux command. The results indicate Nginx is installed however it is not enabled on the web server.
sudo systemctl status nginx
nginx.service – A high performance web server and a reverse proxy server
Loaded: loaded (/usr/lib/systemd/system/nginx.service; disabled; preset: e>
Active: inactive (dead)
Docs: man:nginx(8)
Copy and paste the following commands to start Nginx and enable autostart when server boots.
sudo systemctl start nginx
sudo systemctl enable nginx
Confirm that HTTPS connection from client to web server is working correctly.
curl -I https://webserver.com -v
Lab 4: SSL/TLS Certificate Mismatch
Incident Report
Browser reports this SSL certificate error when connecting to https://webserver.com
Your connection is not private.

Ping Network Connection Test
Verify there is network connectivity with ping test from client to web server.
ping -c 10 192.168.200.1
PING 192.168.200.1 (192.168.200.1) 56(84) bytes of data.
— 192.168.200.1 ping statistics —
10 packets transmitted, 10 received, 0% packet loss, time 9019ms
rtt min/avg/max/mdev = 5.105/6.314/7.589/0.744 ms
Tcpdump Server-Side Capture
Copy and paste tcpdump command to web server to capture all traffic with source or destination IP address of client. Tcpdump will only capture packets with TCP source or destination port 443.
sudo tcpdump -i ens2 -nn -s0 -w lab4_server_tls.pcap host 192.168.10.1 and tcp port 443
Generate Application Traffic
This curl command tests HTTPS connection to web server and only returns response headers (-I) when connected. Copy and paste curl command to client to simulate browser connection to web server.
curl -I https://webserver.com -v
The results indicate connection to web server TCP port 443 was successful. Details of SSL/TLS handshake are also provided that terminate with SSL certificate problem. The curl command could not verify the legitimacy of the server. This suggests a problem with SSL certificate configuration or some other issue preventing HTTPS connection.
Host webserver.com:443 was resolved.
IPv6: (none)
IPv4: 192.168.200.1
Trying 192.168.200.1:443...
Connected to webserver.com (192.168.200.1) port 443
ALPN: curl offers h2,http/1.1
TLSv1.3 (OUT), TLS handshake, Client hello (1):
CAfile: /etc/ssl/certs/ca-certificates.crt
CApath: /etc/ssl/certs
TLSv1.3 (IN), TLS handshake, Server hello (2):
TLSv1.3 (IN), TLS handshake, Encrypted Extensions (8):
TLSv1.3 (IN), TLS handshake, Certificate (11):
TLSv1.3 (OUT), TLS alert, unknown CA (560):
SSL certificate problem: self-signed certificate
Closing connection
curl: (60) SSL certificate problem: self-signed certificate

curl failed to verify the legitimacy of the server and therefore could not
establish a secure connection to it.
Ctrl + C to stop tcpdump capture on server.
Copy Capture File to Windows Directory
Copy and paste this command on web server to start Python HTTP server listening on TCP port 8000. This enables copying of capture file from web server to Windows home directory.
python3 -m http.server 8000
Open Windows CMD prompt and copy capture file (.pcap) using curl from web server to Windows User directory for wireshark analysis.
curl -O http://localhost:8000/lab4_server_tls.pcap
Ctrl + C to exit from Python HTTP server.
Wireshark Import
File -> Open -> Navigate to C:\Users\<username>\lab4_server_tls.pcap
Wireshark Display Filter
Go to ‘apply a display filter’ box below menu items and enter a filter.
tls
tcp.flags
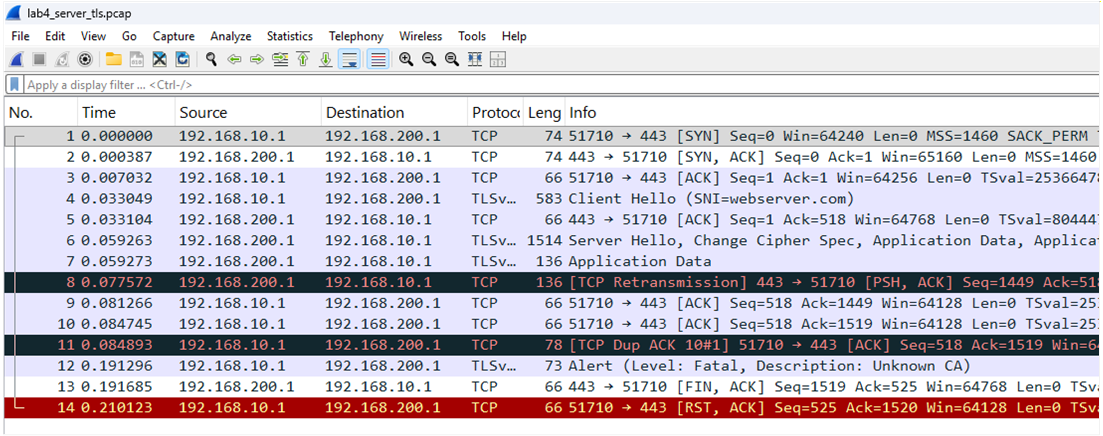
Wireshark Trace Analysis
TCP handshake to web server is successful: SYN / SYN-ACK / ACK .
Client sends TLS Hello to web server for starting handshake.
Web server responds with TLS Hello and SSL/TLS certificate.
Client sends TLS Alert to web server (does not trust unknown certificate).
Web server sends TCP FIN packet to graceful close client connection.
Client sends RST packet to hard close web server connection.
Explanation
SSL self-signed certificate is installed on web server however the certificate was not installed on client causing SSL certificate mismatch. Modern web servers do not typically allow connection from browsers if there is an SSL certificate mismatch.
DNS query -> TCP handshake -> SSL/TLS handshake -> HTTP GET request
Copy and paste this command to client that will ignore SSL certificate error (-k) and connect to web server. This simulates what would happen if the SSL certificate was valid. You can also issue command with -v to display TLS handshake completion.
curl -I -k https://webserver.com
Lab 5: HTTP 405 Method Not Allowed
Incident Report
Browser reports this error when connecting to https://webserver.com
405 Method Not Allowed
The request could not be understood by the server due to malformed syntax.

Ping Network Connection Test
Verify there is network connectivity with ping test from client to web server.
ping -c 10 192.168.200.1
PING 192.168.200.1 (192.168.200.1) 56(84) bytes of data.
— 192.168.200.1 ping statistics —
10 packets transmitted, 10 received, 0% packet loss, time 9025ms
rtt min/avg/max/mdev = 3.402/6.492/16.120/3.383 ms
Tcpdump Server-Side Capture
Copy and paste tcpdump command to web server to capture traffic with source or destination IP address of client. Tcpdump will only capture packets with TCP source or destination port 443.
sudo tcpdump -i ens2 -nn -w lab5_http_400_error.pcap host 192.168.10.1 and tcp port 443
Generate Application Traffic
This curl command sends a malformed or invalid request (-X) to web server. Copy and paste curl command to client to simulate browser connection to web server.
curl -I -X GETT https://webserver.com -v
The web server response to client was HTTP 405 Not Allowed error, so this is an application layer issue.
Host webserver.com:443 was resolved.
IPv6: (none)
IPv4: 192.168.200.1
Trying 192.168.200.1:443...
Connected to webserver.com (192.168.200.1) port 443
SSL certificate verify ok.
GETT / HTTP/1.1
Host: webserver.com

HTTP/1.1 405 Not Allowed
Server: nginx/1.24.0 (Ubuntu)
Excess found: excess = 166 url = / (zero-length body)
Ctrl + C to stop tcpdump capture on web server.
Copy Capture File to Windows Directory
Type this command on web server to start Python HTTP server listening on TCP port 8000. This enables copying of capture file from web server to Windows home directory.
python3 -m http.server 8000
Open Windows CMD prompt and copy capture file (.pcap) using curl from web server to Windows User directory for wireshark analysis.
curl -O http://localhost:8000/lab5_http_400_error.pcap
Ctrl + C to exit from Python server.
Wireshark Import
File -> Open -> Navigate to C:\Users\<username>\lab5_http_400_error.pcap
Wireshark Display Filter
Go to ‘apply a display filter’ box below menu items and enter a filter.
tcp.flags
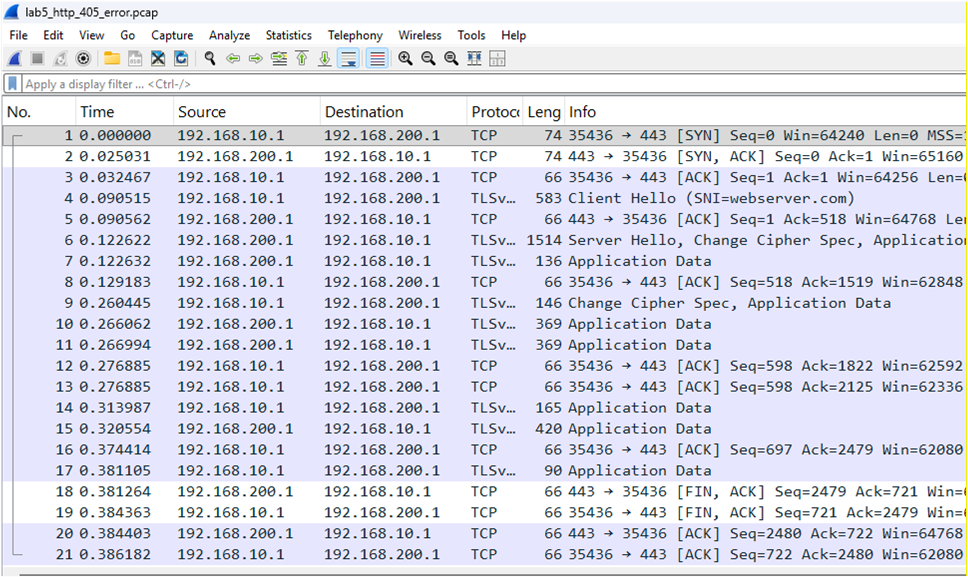
Wireshark Trace Analysis
TCP handshake was successful to web server.
SSL/TLS handshake was successful to web server.
Web server sends TCP FIN packet to graceful close client connection.
Client sends TCP FIN packet to close web server connection.
Explanation
GETT request simulates sending an invalid HTTP method (GETT) instead of GET, POST etc. to web server. The response code from web server is 400 Bad Request Error. Application layer HTTP headers and payload are encrypted and not visible in trace. The curl command generates session keys when communicating with web server and can decrypt data to show headers along with errors and payload. Wireshark can verify if any others errors exist, and curl verbose mode is used to display malformed request where typo GETT was used instead of valid GET method. Check the web server log as well with command sudo tail -f /var/log/nginx/error.log when troubleshooting.
GETT / HTTP/1.1
Host: webserver.com
DNS query -> TCP handshake -> SSL/TLS handshake -> HTTP GETT request
Lab 6: HTTP 404 Not Found
Incident Report
Browser reports this error when connecting to https://webserver.com
404 Not Found
The requested URL /nonexistent.html was not found on this server.

Ping Network Connection Test
Verify there is network connectivity with ping test from client to web server.
ping -c 10 192.168.200.1
PING 192.168.200.1 (192.168.200.1) 56(84) bytes of data.
— 192.168.200.1 ping statistics —
10 packets transmitted, 10 received, 0% packet loss, time 9318ms
rtt min/avg/max/mdev = 3.557/5.944/10.768/2.356 ms
Tcpdump Server-Side Capture
Copy and paste tcpdump command to web server to capture traffic with source or destination IP address of client. Tcpdump will only capture packets with TCP source or destination port 443.
sudo tcpdump -i ens2 -nn -w lab6_http_404_error.pcap host 192.168.10.1 and tcp port 443
Generate Application Traffic
This curl command sends GET request from client to web server with URL that does not exist. Copy and paste curl command to client to simulate browser connection to web server.
curl -I https://webserver.com/nonexistent.html
The web server response to client was HTTP 404 Not Found error, so this is an application layer issue.
HTTP/1.1 404 Not Found
Server: nginx/1.24.0 (Ubuntu)
Date: Mon, 02 Mar 2026 23:26:16 GMT
Content-Type: text/html
Content-Length: 162
Connection: keep-alive
Ctrl + C to stop tcpdump capture on web server.
Copy Capture File to Windows Directory
Type this command on web server to start Python HTTP server listening on TCP port 8000. This enables copying of capture file from web server to Windows home directory.
python3 -m http.server 8000
Open Windows CMD prompt and copy capture file (.pcap) using curl from web server to Windows User directory for wireshark analysis.
curl -O http://localhost:8000/lab6_http_404_error.pcap
Ctrl + C to exit from Python server.
Wireshark Import
File -> Open -> Navigate to C:\Users\<username>\lab6_http_404_error.pcap
Wireshark Display Filter
Go to ‘apply a display filter’ box below menu items and enter a filter.
tcp.flags
Wireshark Trace Analysis
TCP handshake was successful to web server.
SSL/TLS handshake was successful to web server.
Web server sends TCP FIN packet to graceful close client connection.
Client sends TCP FIN packet to close web server connection.
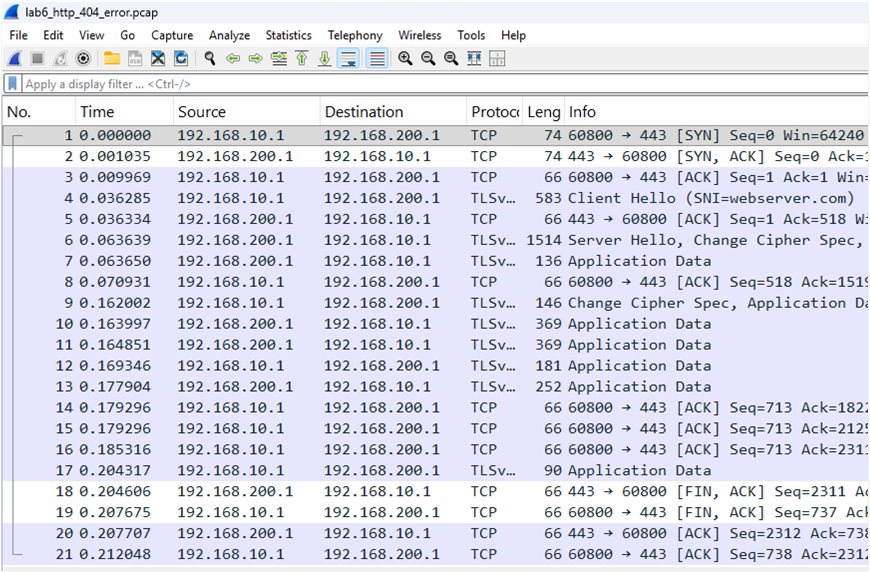
Explanation:
The browser error message indicates web server could not find the requested URL/path
https://webserver.com/nonexistent.html so problem is with path and/or web page name.
DNS query -> TCP handshake -> SSL/TLS handshake -> HTTP GET request
Lab 7: DNS Name Not Resolved
Incident Report
Browser reports this error when connecting to https://webserver.com
This site can’t be reached
webserver.com server IP address could not be found.
ERR_NAME_NOT_RESOLVED

Ping Network Connection Test
Verify there is network connectivity with ping test from client to web server.
ping -c 10 192.168.200.1
PING 192.168.200.1 (192.168.200.1) 56(84) bytes of data.
— 192.168.200.1 ping statistics —
10 packets transmitted, 10 received, 0% packet loss, time 9022ms
rtt min/avg/max/mdev = 4.098/6.848/8.279/1.054 ms
Verify that DNS is working correctly with ping test using hostname of web server. The results confirm that DNS resolution failed to resolve webserver.com hostname.
ping -c 10 webserver.com
ping: webserver.com: Temporary failure in name resolution
Tcpdump Client-Side Capture
Copy and paste tcpdump command to client to capture all DNS traffic on interface ens2. Tcpdump will only capture packets with UDP port 53 or TCP port 53. The & operator will run tcpdump capture in the background so that curl command can be run in foreground.
sudo tcpdump -i ens2 -nn -s0 -w lab7_dns_error.pcap udp port 53 or tcp port 53 &
Generate Application Traffic
This curl command tests HTTPS application connection to web server and only returns response headers (-I). Copy and paste curl command to client to simulate browser connection to web server.
curl -I https://webserver.com -v
The result confirms there is a DNS server failure to resolve webserver.com hostname.
Could not resolve host: webserver.com
Closing connection
curl: (6) Could not resolve host: webserver.com
Stop tcpdump capture running in the background on client with this command.
sudo pkill tcpdump
Copy Capture File to Windows Directory
Type this command on client to start Python HTTP server listening on TCP port 8001. This enables copying of capture file from client to Windows home directory.
python3 -m http.server 8001
Open Windows CMD prompt and copy capture file (.pcap) using curl from client to Windows User directory for wireshark analysis.
curl -O http://localhost:8001/lab7_dns_error.pcap
Ctrl + C to exit from Python server.
Wireshark Import
File -> Open -> Navigate to C:\Users\<username>\lab7_dns_error.pcap
Analyze -> Expert Information -> select DNS events
Wireshark Display Filter
Go to ‘apply a display filter’ box below menu items and enter a filter.
dns
Wireshark Trace Analysis
DNS query: A webserver.com
DNS response: Server failure A webserver.com
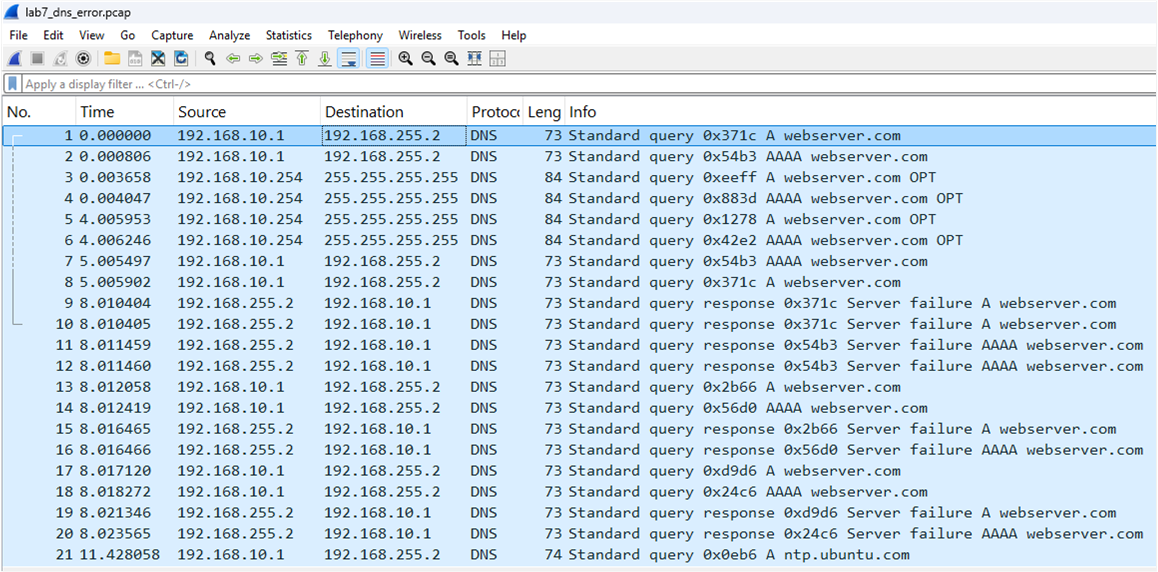
Explanation
Client sends DNS query that is forwarded to the DNS server (SW2) for resolution. DNS response indicates failure to resolve A record. Type the following IOS command on SW2 to display all DNS A records.
SW2#show hosts
DNS A record for webserver.com does not exist on DNS server causing failure of DNS resolution. The command ping 192.168.200.1 also confirmed this since it connected successfully to web server with correct IP address. TCP handshake will only start after DNS resolves hostname webserver.com to IP address 192.168.200.1 first.
DNS query -> TCP handshake -> SSL/TLS handshake -> HTTP GET request
Configure this command on SW2 to add DNS A record for resolution of webserver.com hostname.
SW2(config)#ip host webserver.com 192.168.200.1
Lab 8: DNS Connection Timed Out
Incident Report
Browser reports this error when connecting to https://webserver.com
This site can’t be reached
webserver.com took too long to respond.
ERR_CONNECTION_TIMED_OUT

Ping Network Connection Test
Verify there is network connectivity with ping test from client to web server.
ping -c 10 192.168.200.1
PING 192.168.200.1 (192.168.200.1) 56(84) bytes of data.
— 192.168.200.1 ping statistics —
10 packets transmitted, 10 received, 0% packet loss, time 9209ms
rtt min/avg/max/mdev = 3.513/6.875/11.515/2.493 ms
Tcpdump Client-Side Capture
Copy and paste tcpdump command to client to capture all traffic on interface ens2. The & operator will run tcpdump capture in the background so that curl command can be run in foreground.
sudo tcpdump -i ens2 -nn -s0 -w lab8_dns_error.pcap udp port 53 or tcp port 53 &
Generate Application Traffic
This curl command tests HTTPS application connection to web server and only returns response headers (-I). Copy and paste curl command to client to simulate browser connection to web server.
curl -I https://webserver.com -v
The result confirms DNS configuration error since webserver.com resolves to 192.168.255.1 (R1). This is incorrect since 192.168.200.1 is assigned to web server.
Host webserver.com:443 was resolved.
IPv6: (none)
IPv4: 192.168.255.1
Trying 192.168.255.1:443...
connect to 192.168.255.1 port 443 from 192.168.10.1 port 52096 failed: Connection refused
Failed to connect to webserver.com port 443 after 9033 ms: Couldn't connect to server
Closing connection
curl: (7) Failed to connect to webserver.com port 443 after 9033 ms: Couldn't connect to server
Stop tcpdump capture running in the background on client with this command.
sudo pkill tcpdump
Copy Capture File to Windows Directory
Type this command on client to start Python HTTP server listening on TCP port 8001. This enables copying of capture file from client to Windows home directory.
python3 -m http.server 8001
Open Windows CMD prompt and copy capture file (.pcap) using curl from client to Windows User directory for wireshark analysis.
curl -O http://localhost:8001/lab8_dns_error.pcap
Ctrl + C to exit from Python HTTP server.
Wireshark Import
File -> Open -> Navigate to C:\Users\<username>\lab8_dns_error.pcap
Analyze -> Expert Information -> select DNS events
Wireshark Display Filter
Go to ‘apply a display filter’ box below menu items and enter a filter.
dns
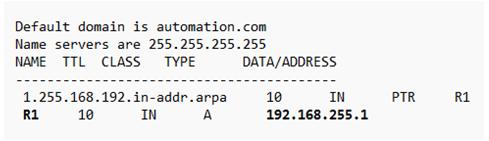
Wireshark Trace Analysis
DNS query: A webserver.com
DNS response: A webserver.com 192.168.255.1
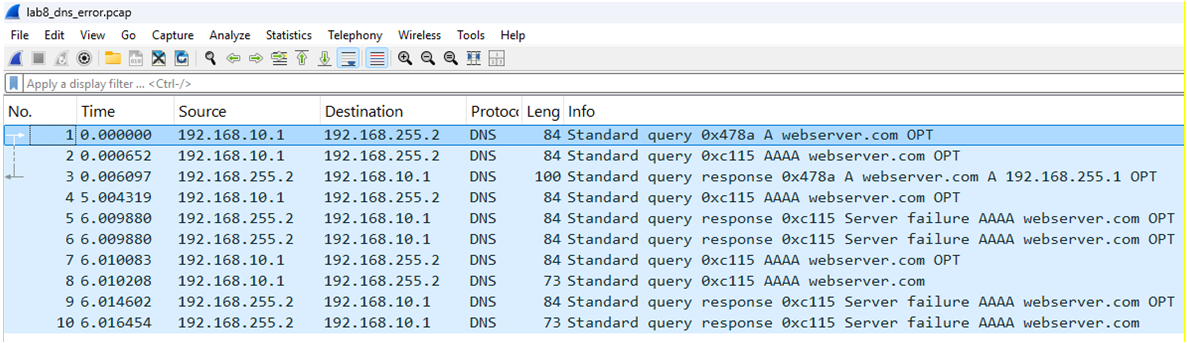
Explanation
DNS query response confirms in trace that webserver.com is resolved to 192.168.255.1 however that is R1. The connection to TCP port 443 fails since R1 has disabled HTTPS service. Clients that connect to R1 with HTTP server enabled would connect successfully with no errors. This would make troubleshooting easier since banner web page of Cisco device would confirm DNS configuration error.
DNS query -> TCP handshake -> SSL/TLS handshake -> HTTP GET request
Configure the following commands on SW2 to delete and modify DNS A record for correct IP address of webserver.com hostname.
SW2(config)#no ip host webserver.com 192.168.255.1
SW2(config)#ip host webserver.com 192.168.200.1
SW2(config)#clear ip dns cache
Lab 9: HTTP 504 Gateway Timeout
Incident Report
Browser reports this error when connecting to https://webserver.com
This site can’t be reached webserver.com took too long to respond.
ERR_GATEWAY_TIMEOUT

Ping Network Connection Test
Verify there is network connectivity with ping test from client to web server.
ping -c 10 192.168.200.1
PING 192.168.200.1 (192.168.200.1) 56(84) bytes of data.
— 192.168.200.1 ping statistics —
10 packets transmitted, 10 received, 0% packet loss, time 9020ms
rtt min/avg/max/mdev = 3.852/6.174/11.229/2.005 ms
Tcpdump Server-Side Capture
Copy and paste tcpdump command to web server to capture traffic with source or destination IP address of client. Tcpdump will only capture packets with TCP source or destination port 443 or port 8080 assigned to reverse proxy. The reverse proxy listens on ens2 and backend server (same VM) listens on lo interface. This is the reason for -i any designated as capture interface.
sudo tcpdump -i any -nn -w lab9_http_504_error.pcap ‘(host 192.168.10.1) and (tcp port 443 or tcp port 8080)’
Generate Application Traffic
Copy and paste this command to web server to simulate timeout from reverse proxy to backend server that is busy.
sudo tc qdisc replace dev lo root netem delay 7000ms
This curl command tests HTTPS application connection to web server and only returns response headers (-I). Copy and paste curl command to client to simulate browser connection to web server.
curl -I https://webserver.com
The web server response to client was HTTP 504 Gateway Time-out error, so this is an application layer issue.
HTTP/1.1 504 Gateway Time-out
Server: nginx/1.24.0 (Ubuntu)
Date: Wed, 04 Mar 2026 04:57:41 GMT
Content-Type: text/html
Content-Length: 176
Connection: keep-alive
Ctrl + C to stop capture on web server.
Copy Capture File to Windows Directory
Type this command on web server to start Python HTTP server listening on TCP port 8000. This enables copying of capture file from web server to Windows home directory.
python3 -m http.server 8000
Open Windows CMD prompt and copy capture file (.pcap) using curl from web server to Windows User directory for wireshark analysis.
curl -O http://localhost:8000/lab9_http_504_error.pcap
Ctrl + C to exit from Python HTTP server.
Wireshark Import
File -> Open -> Navigate to C:\Users\<username>\lab9_http_504_error.pcap
Wireshark Display Filter
Go to ‘apply a display filter’ box below menu items and enter a filter.
tcp.flags
Wireshark Trace Analysis
TCP handshake was successful from client to web server.
TLS handshake was successful from client to web server.
No traffic to client for five seconds when backend server is busy and not responding.
Web server sends TCP FIN packet to graceful close client connection.
Client sends TCP FIN packet to close web server connection.
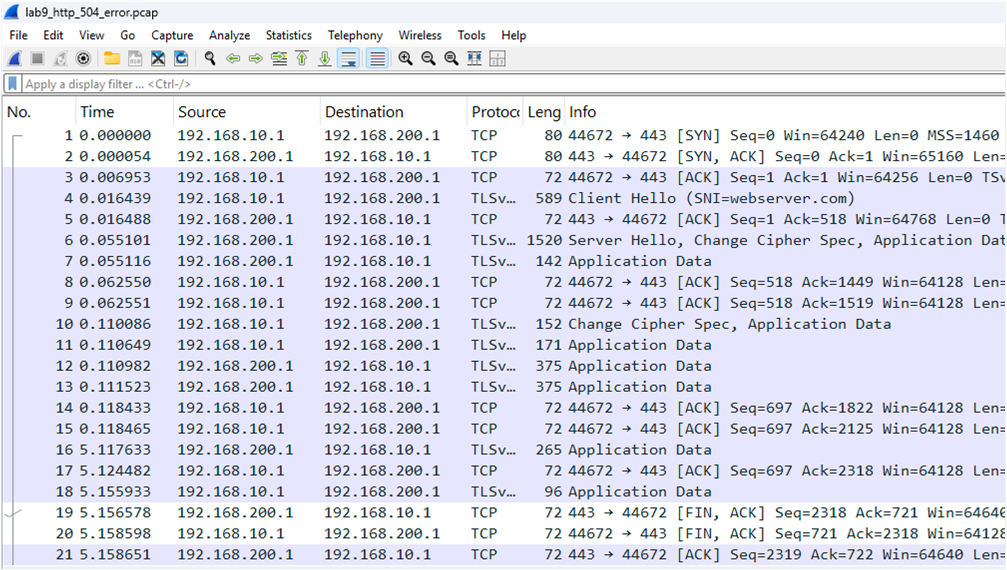
Explanation
The web server is configured with reverse proxy so that any inbound HTTPS requests are sent to backend server port 8080. There is a server busy simulation using netem to add seven seconds delay that causes reverse proxy to return 504 Gateway Timeout error to client. The reverse proxy has a timeout of five seconds when upstream server does not respond. Wireshark trace shows the TCP handshake to web server and TLS handshake successful. After five seconds of waiting for backend server to respond, the 504 Gateway Timeout error is sent to client with FIN to close connection. The root cause is a busy server that causes timeout to client.
DNS query -> TCP handshake -> SSL/TLS handshake -> HTTP GET request