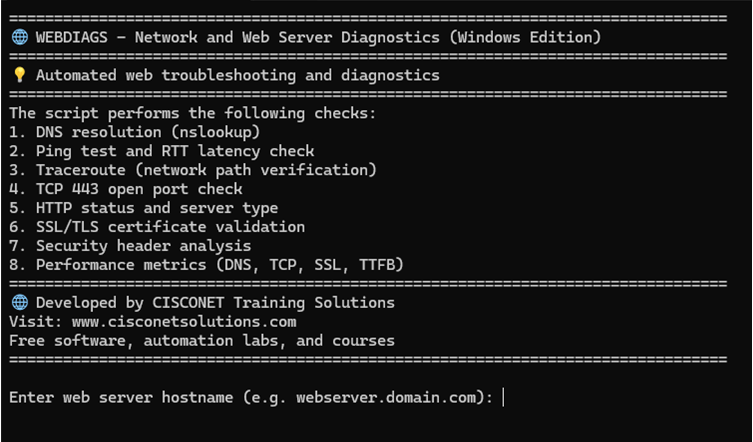
WebDiags a lightweight diagnostic tool for software developers, DevOps, and network engineers. It automates troubleshooting tasks and generates a summary HTML report shareable via email. By running a suite of automated tests, this streamlines root cause analysis and enables troubleshooting collaboration across IT teams. There is a Linux version and Windows 10/11 version available for download.
- Developers/DevOps: Run automated diagnostics for troubleshooting application problems.
- Sysadmins: Check DNS and investigate network performance issues.
- Network Engineers: Perform quick network and application-layer diagnostics.
- Students: Learn real-world web diagnostics and troubleshooting.
- DNS and network connectivity problems
- SSL/TLS certificate errors
- HTTP/HTTPS service status and codes
- Check firewall filtering of application ports
Whether your deploying a new application or investigating an incident, this tool quickly provides a shareable report to accelerate the troubleshooting process. When a web application goes down or performance is slow, where do you even start? Is it DNS? network latency? misconfigured server? SSL certificate expired? For software developers finding the root cause can be like searching for a needle in a haystack, especially when time is critical.
WebDiags Linux version requires sudo privilege, traceroute, and dnsutils install.
sudo apt install traceroute
sudo apt install dnsutils
Download Automated Web Diagnostics Tool
Application downloads are available for Windows and Linux versions that include a readme and documentation.
Extract webdiags-win.zip from downloads directory and copy icon to desktop. Ignore the standard unknown publisher warning .exe is not digitally signed and select run anyway. The report is generated automatically and web browser opens to view.
Copy webdiags.tar.gz from Windows downloads directory to USB and then remove USB.
Start Ubuntu VM and select VM settings -> USB Controller -> USB compatibility 3.1
Insert USB
select virtual machine hostname
sudo mkdir -p /mnt/usb
lsblk (find usb name e.g., sdb1 etc.)
sudo mount /dev/sdb1 /mnt/usb
sudo cp /mnt/usb/webdiags.tar.gz .
Untar file in home directory (webdiage.exe, readme.txt, documentation.txt)
tar -xzvf webdiags.tar.gz
sudo umount /mnt/usb
Start the application with this command.
./webdiags
*Linux desktop users can copy tar file directly from downloads directory to user home directory with File Manager and untar file.
Diagnostics Report: udemy.com
- DNS Lookup
🌎 DNS Lookup successful (system default):
Server:  node-1w7jr9n24twqzs2cg5ed4tjl3.ipv6.telus.net
Address:  2001:568:ff09:10c::67

Name:    udemy.com
Addresses:  2606:4700::6810:8fed
	  2606:4700::6810:8eed
	  104.16.143.237
	  104.16.142.237

Non-authoritative answer:
- Ping Test
📶 Ping test successful: Pinging 104.16.143.237 with 32 bytes of data: Reply from 104.16.143.237: bytes=32 time=22ms TTL=60 Reply from 104.16.143.237: bytes=32 time=21ms TTL=60 Reply from 104.16.143.237: bytes=32 time=20ms TTL=60 Reply from 104.16.143.237: bytes=32 time=20ms TTL=60 Ping statistics for 104.16.143.237: Packets: Sent = 4, Received = 4, Lost = 0 (0% loss), Approximate round trip times in milli-seconds: Minimum = 20ms, Maximum = 22ms, Average = 20ms - Tracert
⚠️ Tracert completed with timeouts:

Tracing route to 104.16.143.237 over a maximum of 15 hops

  1    18 ms    16 ms    16 ms  192.168.1.254
  2    17 ms    18 ms    18 ms  10.27.146.1
  3     *        *        *     Request timed out.
  4     *        *        *     Request timed out.
  5     *        *        *     Request timed out.
  6    23 ms    19 ms    19 ms  104.16.143.237

Trace complete.
- Port 443 Check
🔓 Port 443 on 104.16.143.237 is open.
- HTTP Status
🟢 HTTPS 200 OK - Service OK on https://udemy.com
Server: cloudflare
- SSL Check
📜 SSL Certificate Details:
  - Valid From: 2025-10-24 01:26:33
  - Valid Until: 2026-01-22 02:26:31
  - Expires in: 70 days
- HTTP Headers
--- All Response Headers ---
Date: Wed, 12 Nov 2025 17:34:41 GMT
Content-Type: text/html; charset=utf-8
Transfer-Encoding: chunked
Connection: keep-alive
Content-Encoding: gzip
CF-Ray: 99d7c8123bcdec50-SEA
CF-Cache-Status: HIT
Age: 177
Cache-Control: s-maxage=14400, stale-while-revalidate
Set-Cookie: __udmy_2_v57r=7f68b789ac894e76919cb4bc127cc332; Domain=.udemy.com; expires=Thu, 12 Nov 2026 17:34:41 GMT; Max-Age=31536000; Path=/; Secure, ud_country_code=CA; Domain=.udemy.com; expires=Wed, 12 Nov 2025 17:35:11 GMT; Max-Age=30; Path=/; Secure
Vary: Accept-Encoding
x-cf-worker-deploy-env: production
x-cf-worker-locale: en
x-cf-worker-name: worker-udemy-com
x-cf-worker-origin-status-code: 200
x-cf-worker-version: d553d29
X-Content-Type-Options: nosniff
x-envoy-upstream-service-time: 9
x-nextjs-cache: HIT
x-nextjs-pagekey: discovery_logged_out_home
x-nextjs-version: f4495b8
Server: cloudflare

--- Security Header Analysis ---
🚫 Missing Strict-Transport-Security (Enforces HTTPS.)
🚫 Missing Content-Security-Policy (Mitigates XSS attacks.)
🚫 Missing X-Frame-Options (Prevents clickjacking.)
🛡️ X-Content-Type-Options: nosniff (Prevents MIME sniffing.)
🚫 Missing Referrer-Policy (Controls referrer info.)
🚫 Missing Permissions-Policy (Restricts browser features.)

--- Security Headers Score: 1/6 ---
- Performance Metrics
📡 HTTP Status Code: 200
⚡ Performance Metrics (ms):
  - DNS Lookup: 9.91
  - TCP Handshake: 67.47
  - SSL Handshake: 79.70
  - Server Processing Delay: 382.52
  - Time to First Byte (TTFB): 539.60
Web Diagnostic Tests
DNS Resolution
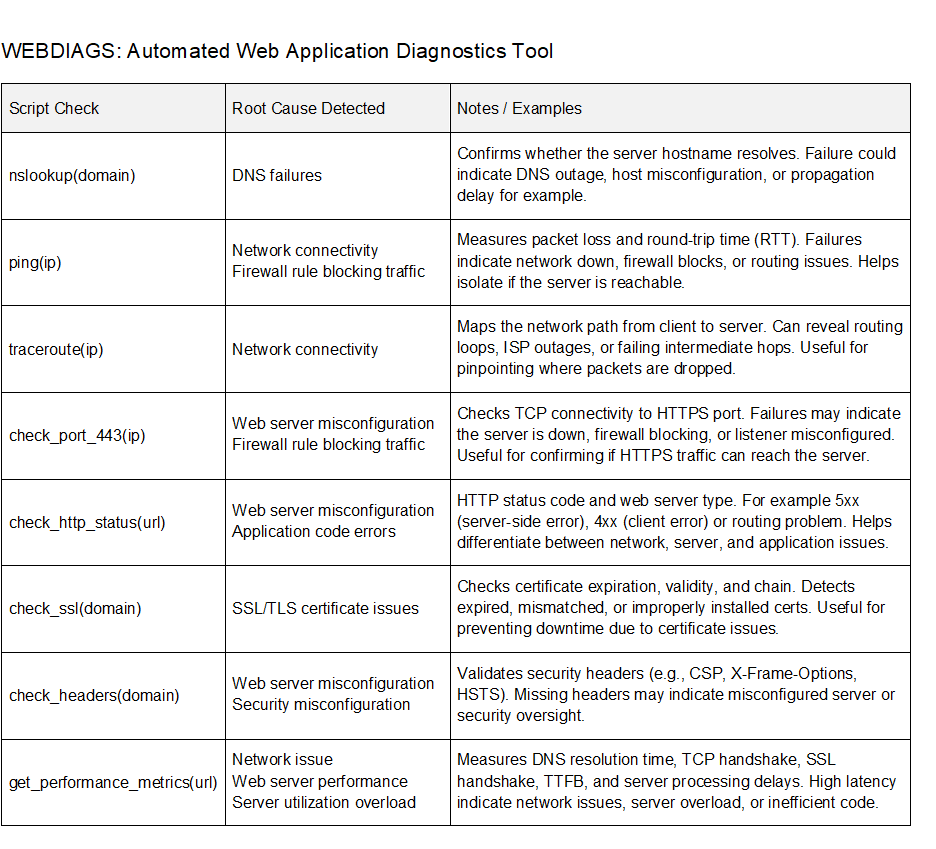
This diagnostic test prompts the user for web server hostname and attempts to resolve it to an IP address. The nslookup command is used to query DNS records based on the provided domain name. Select the first authoritative or non-authoritative answer (IP address) to use for ping test.
If successful, the test confirms the domain name is registered and DNS server is reachable. The test also confirms there is an A record configured on the DNS server. This does not necessarily verify that the DNS record is correct, only that one exists. For additional troubleshooting you could do reverse DNS lookup or verify registered IP address. Failure here usually means there is a DNS misconfiguration or network connectivity issues with your DNS server. The DNS query is sent to the IP address of DNS server configured on local machine (/etc/resolv.conf) for Linux. Common issues include misconfigured or missing DNS records (A, AAAA, CNAME) and DNS propagation delays after recent changes. There is also misspelled or expired domain names that will cause DNS failure.
✅ If you see authoritative or non-authoritative answers then DNS has resolved hostname.
❌ If you get a “NXDOMAIN” or timeout, there is a DNS configuration error or server is offline.
Ping Test
Verify basic connectivity between local machine and web server to confirm it is reachable. The ping command sends four ICMP echo request packets to web server and waits for echo replies. The output includes round-trip time (latency) in milliseconds and packet loss (%). If ping fails entirely, the server may be offline, blocking ICMP, or behind a firewall blocking ICMP.
✅ Packet loss = 0% and some or all ICMP packets returned = good connectivity. Network latency that is more than 100 msec could indicate some network congestion.
❌ “100% packet loss” or timeouts suggest the server is down, host unreachable, ICMP filtering, or incorrect IP address.
Traceroute
Check the network path from local machine to web server to identify routing issues or bottlenecks. Traceroute command sends ICMP packets and logs the IP address of each router (hop) along the route to server. The results reveal if there are delays, packet drops, or unreachable routers that could be offline for example. This is useful for pinpointing latency issues within an ISP or internal network routing loops.
✅ Each hop shows the assigned IP address and latency.
❌ Timeouts or abrupt ends may indicate ICMP filtering, routing issues, or device offline.
TCP 443 Open Port Check
Confirm that a firewall is not blocking HTTP/HTTPS application port 443 and listening on web server. The diagnostic test attempts to open a TCP connection to the user selected port based on IP address from ping test. The result confirms whether there is a firewall rule filtering an application port or server misconfiguration.
✅ Connection succeeds message is returned when the server is listening on the selected application port and no firewall blocking.
❌ Connection timeouts occur when server is offline, overloaded, or firewall is filtering application port. Connection refused errors occur when application port is closed or server misconfiguration.
HTTP Server Status Check
Verify that HTTP service is running on the web server and detect response code (200 OK, 404 Not Found, 500 Internal Server Error). This diagnostic test also detects the server type whether it is Apache, NGINX, LiteSpeed, or other type. HTTP GET request is sent to the web server based on hostname from DNS check and redirects are followed. The test attempts three separate requests and returns the first successful response it receives. The purpose of this test is to detect specific error codes returned by web server when troubleshooting application issues.
200 OK: ✅ Normal operation
301/302: Redirects
4xx: ❌ Client error (e.g., 404 not found, 403 forbidden, 400 bad request etc.)
5xx: ❌ Server error (e.g., 500 internal server error, 503 service unavailable, 504 bad gateway)
| Status | Error Name | Common Root Causes / Examples |
|---|---|---|
| 400 | Bad Request | Malformed URL or JSON, Missing required fields, Invalid query parameters |
| 401 | Unauthorized | Missing or invalid API token, No Authorization header, User not authenticated |
| 403 | Forbidden | Insufficient permissions, IP blocked, Access control restrictions |
| 404 | Not Found | Incorrect URL, Resource removed, File or page doesn’t exist |
| 405 | Method Not Allowed | POST on GET-only route, Unsupported method, Misconfigured route |
| 408 | Request Timeout | Client took too long, Server timed out, Slow connection |
| 409 | Conflict | Duplicate resource, Version conflict, Simultaneous edits |
| 429 | Too Many Requests | Rate limit exceeded, API throttling, Bot activity |
| 500 | Internal Server Error | Code bugs, Crash in backend, Misconfigured server |
| 501 | Not Implemented | Feature not available, Method not supported, Stub endpoint |
| 502 | Bad Gateway | Upstream server failure, Reverse proxy issue, DNS failure |
| 503 | Service Unavailable | Overloaded server, Maintenance mode, Rate limiting |
| 504 | Gateway Timeout | Backend server too slow, DB query timeout, Load balancer delay |
| 505 | HTTP Version Not Supported | Old HTTP version, Client incompatibility, Legacy tool in use |
SSL Certificate Check
Check SSL/TLS certificate validity period, expiry date, and number of days remaining. The diagnostic test connects over port 443 and inspects the SSL certificate presented by the server. Expired SSL/TLS certificates compromise web application security. In fact, when HSTS is enabled, an expired certificate would prevent access to an application since HTTPS is mandatory.
✅ Days remaining until expiration.
❌ Errors for expired, invalid, or unreachable certificate.
Check HTTP Headers
Sends an HTTP request to the specified domain to fetch response headers from web server. The web server responds with headers that are based on server configuration and operational state. The diagnostic test also analyzes security headers and generates a posture score. HTTP header check is used to detect web server configuration settings that are key to troubleshooting web applications.
- Identify server software (Server, X-Powered-By)
- Check caching behavior (Cache-Control, ETag, Expires)
- Content settings (Content-Type, Content-Encoding)
- Authentication or session controls (Set-Cookie, WWW-Authenticate)
- Debugging reverse proxies (Via, X-Forwarded-For)
- Server overload or rate limiting (Retry-After)
- HTTPS enforcement (Strict-Transport-Security)
Application Performance Metrics
This diagnostic test measures connect time latency based on DNS lookup, TCP handshake, and SSL handshake. The results are used to detect problems with network congestion and busy servers. There is also Time to First Byte (TTFB) metric that measures amount of time from when a request is made to when server sends first byte. This is a key application metric that essentially represents server processing delay. Application response time measures how long for a web page to load and is mostly affected by network latency between client and server.
DNS lookup query is done first to resolve web server domain name (hostname) to an IP address. This is required so that client has a destination IP address for routing packets to web server. Firewall filtering of UDP 53 will prevent DNS query through firewall to DNS server. TCP handshake from client then makes a host connection to the web server socket with IP address and port 443. After that, SSL/TLS protocol handshake is initiated to web server for HTTPS data encryption. Connect time is the cumulative amount of time for all three protocols to finish successfully.
Client sends GET request for a web page based on HTTPS to the web server. At this point there is some server processing delay that could include backend server processing for dynamic content. The web server finally starts sending data to the client and when the first byte arrives this is TTFB. There is a direct correlation between server processing delay and TTFB, since an overloaded server will increase TTFB.
Public DNS servers such as Cloudflare for example are recommended for maximum speed and reliability. Network latency is mostly eliminated with CDNs that provide local internet access points globally with cached content. Implementing HTTP/2 with TLS 1.3 will provide the fastest SSL handshake with session resumption.
- DNS Lookup (UDP 53)
- TCP Handshake (port number)
- SSL Handshake (HTTPS)
- Server Processing Delay = TTFB – Connect Time
- Time to First Byte (TTFB)
DNS lookup latency causes:
– Slow or overloaded DNS servers
– No DNS caching (e.g., first-time lookup)
– Poor internet connectivity or routing issues
– Use fast reliable DNS servers (Cloudflare etc.)
TCP handshake latency causes:
– Long physical distance to origin web server
– Network congestion
– Firewalls or proxies slowing handshake
– Packet loss or TCP retransmissions
SSL/TLS certificate handshake latency causes:
– Server-side TLS misconfiguration
– Large certificate chains
– No session resumption (TLS 1.3 required)
Common Web Application Errors and Diagnostic Tests
| Error Type | Diagnostic Test from Script |
|---|---|
| 500 Internal Server Error | ✅ Fetch error log |
| DNS Resolution Failures | ✅ nslookup |
| Port Blocked / Connection Refused | ✅ open port check |
| SSL/TLS Certificate Errors | ✅ SSL/TLS certificate status and expiry date |
| 404 Not Found | ✅ HTTP server status, server type, and error codes |
| CORS Errors | ✅ HTTP response headers and security score |
| Timeout or Latency Issues | ✅ measure DNS, TCP, SSL (connect time) and TTFB latency |
| Network Connectivity and Routing Issues | ✅ ping and traceroute |
| Authentication Errors | ✅ HTTP server status and headers |
| Web Server Misconfigurations | ✅ Fetch error log, HTTP server status |
HTML Report Generation
Once all diagnostics are complete, the application asks if want to generate an HTML report. The report includes all test results, clearly marked with ✅ (success) or ❌ (failure). Reports are saved to your local working directory with a filename based on the web server’s domain (e.g., example.com.html). You can easily share them with colleagues or use them for documentation.
User prompt to generate HTML report format.
Each test is marked with ✅ (success) or ❌ (failure).
Saved locally (e.g., example.com.html).
Attach to email for troubleshooting collaboration, testing, and production deployment.
Custom Freeware License and Disclaimer
This software (webdiags.exe) is provided free of charge for personal and non-commercial use only, subject to the following terms:
Permissions
You may redistribute unmodified copies of this software, provided that you retain the copyright notice and this license in all copies. You may use this software on your personal Linux system or Windows for non-commercial purposes.
Restrictions
You may not sell, sublicense, or otherwise distribute this software for commercial purposes. You may not modify, reverse-engineer, or decompile this software, unless explicitly permitted by the author. Any redistribution of the software must retain this license, and the software must not be distributed with commercial intent or for profit.
No Warranty
This software is provided “as-is”, without any warranty of any kind, either express or implied, including but not limited to the warranties of merchantability, fitness for a particular purpose, or non-infringement. In no event shall the author be liable for any damages arising from the use or misuse of this software. Use at your own risk. Be sure to review the generated reports carefully, as they may contain sensitive system information.