The purpose of iPerf3 is to measure LAN/WAN throughput and link quality. Learn how to use iPerf3 for WAN testing and troubleshooting. Labs include ISP througput (CIR), link quality (voice/video), and VoIP QoS validation. Linux network emulator (netem) is used with labs to condition WAN link for testing.
The software is based on a client/server model where TCP or UDP traffic streams are generated between client and server. This is referred to as memory-to-memory socket-level communication for network testing. It is also a popular tool used to troubleshoot network and application problems.
Network Engineers: iPerf used to validate ISP connection, link quality for voice traffic, QoS configuration, and troubleshooting network issues .
Internet Service Providers: Service providers use iPerf to measure and verify the network performance, ensuring they can meet customer expectations.
Cloud Service Providers: iPerf is useful for testing connections between users and cloud services to ensure optimized performance and to pinpoint potential bottlenecks.
iPert3 WAN Lab Examples
- Ethernet WAN CIR
- Ethernet WAN Link Quality
- Broadband WAN CIR
- Broadband Link Quality
- VoIP (G.711/G.729)
- Video Streaming
- Video Conferencing
- VoIP QoS Validation
- VPN Tunnel MTU Mismatch
- Disk Read/Write Throughput
Install Cisco CML Free Version Software
Install Cisco CML free version required for iPerf3 labs. The article includes installation of VMware (free) and how to configure the correct DHCP subnet using virtual editor. Cisco CML also provides access to automation labs available here. There will be Nmap and tcpdump labs available soon as well based on CML.
Cisco CML Free Version Install
Lab Setup and Software Install
The following instructions apply to initial lab setup only so that software is installed on Ubuntu nodes. Keep your laptop plugged in at all times when running iPerf3 labs and follow install instructions in the correct order.
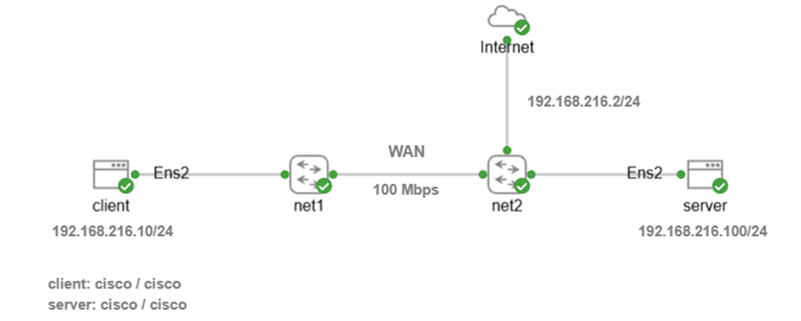
Step 1: Click on link to download iPerf-WAN lab to your downloads directory for import to Cisco CML. This is a YAML text file (IaC) used to create the lab topology shown.
Step 2: Access CML UI from your browser with DHCP assigned IP address shown in the CML VM console (ignore 9090). Select Advanced button to ignore any SSL certificate warnings, and select Proceed.
This command is an example with CML default username admin and password you created when installing CML. The assigned IP address is only an example and could be different.
https://192.168.216.129
Username: admin
Password: **********
Step 3: Select Import and browse to your downloads directory. Select iPerf-WAN.yaml file and import into CML.
Step 4: Start Internet node and Cisco switches manually first with right-click start option. Wait for green check mark to appear for all nodes.
Step 5: Start Ubuntu client node manually with right-click start option. Monitor install from console and wait for cloud-init to finish. The initial install will take approximately 2-3 minutes to configure IP addressing, update packages, and install iPerf3 on Ubuntu client.
[ OK ] Finished cloud-final.service – Cloud-init: Final Stage.
[ OK ] Reached target cloud-init.target – Cloud-init target.
Hit Enter for login
username: cisco
password: cisco
--version
Step 6: Start Ubuntu server node manually only after Ubuntu client is finished. Monitor install from console and wait for cloud-init to finish. The initial install will take approximately 2-3 minutes to configure IP addressing, update packages, and install iPerf3 on Ubuntu server.
[ OK ] Finished cloud-final.service – Cloud-init: Final Stage.
[ OK ] Reached target cloud-init.target – Cloud-init target.
Hit Enter for login
username: cisco
password: cisco
--version
Step 7: Select LAB menu item from top of workspace and click stop lab after login to client and server. This is only done once to reset Ubuntu nodes after install and enable caching of disk images for faster performance.
Step 8: Select LAB menu and click start lab, then wait until green check mark appears on all nodes.
Lab 1: ISP Circuit Testing
This lab measures ISP throughput (CIR) for Ethernet WAN and broadband circuits within the enterprise network. This mostly affects TCP application such as HTTPS, bulk transfers, database, and video streaming. There is also link quality testing that is more applicable to voice and video conferencing applications.
Ethernet WAN is symmetric meaning the speed is equal in both directions (100/100). Conversely, broadband services (DSL, Cable, 5G) are asymmetric since upload speed is lower than download speed (40/100). TCP-based applications are asymmetric with most data sent in the download direction.
The purpose of baselining is to measure normal network behavior so it can be used as a reference point when troubleshooting network issues. It is also used as before/after comparison with a network deployment. This will reveal any degradation of TCP performance and anomalies.
*Keep your laptop plugged in at all times since reduced power to virtual machines will affect iPerf3 performance and test results. Do NOT change power plan from default ‘Balanced’ either since that is recommended for this lab.
Ethernet WAN CIR Testing (100/100)
Select Dashboard and then IPERF-WAN lab if you are starting CML from scratch. Select LAB menu and click start lab and wait until green check mark appears on all nodes.
TCP Upload Throughput (client -> server)
This is a standard upload test that measures throughput and retransmissions from client to server. All TCP tests use nondefault port TCP port 443 since real-world testing would traverse a firewall to the internet. This lab is assigned -p 443 since that port is typically allowed through firewalls. This avoids problems associated with requesting a firewall rule. There is –logfile option as well that is used to save results to a text file for sharing.
Right-click Ubuntu server and select console to login with credentials shown and start iPerf server.
username: cisco
password: cisco
clear
sudo iperf3 -s -p 443
Right-click Ubuntu client and select console to login with credentials shown. Copy and paste iPerf3 command to Ubuntu client then hit enter to start test.
username: cisco
password: cisco
clear
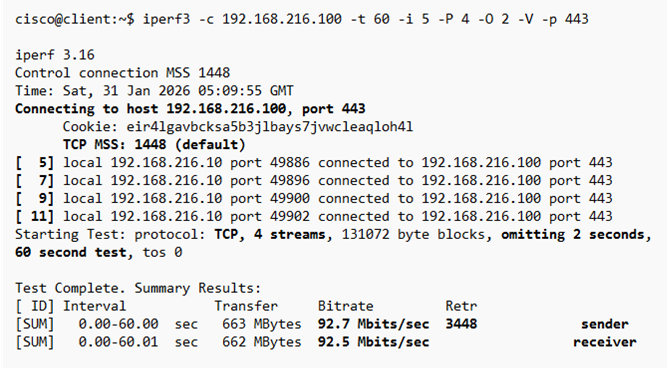
iperf3 -c 192.168.216.100 -t 60 -i 5 -P 4 -O 2 -V -p 443
iPerf3 Test Results
This test result is near line bitrate (92 Mbps) throughput from client to server across Ethernet WAN. iPerf measures real data payload throughput and not theoretical since headers (~5%) are not included. TCP retransmissions should be less than 1% of data transfer (663 MB) for WAN connections. TCP retransmissions of 0.72% calculated for this test is within normal range for WAN performance. iPerf assigns an ID to each flow between client and server. This test assigned [5], [7], [9], and [11] that represent four separate streams where client is sender and server is receiver since it is a forward direction test.
Calculate percent of TCP retransmissions based on data transfer (MB), default MSS (1448 bytes), and number of retransmissions.
TCP Retransmissions Percent Calculator
TCP-based reports also include how TCP congestion window (cwnd) size changes as packets are sent. Linux expands TCP congestion window size up to 128 KB by default as network conditions permit. TCP congestion window also expands after that if network conditions permit and TCP window scaling is enabled. This is evidence that TCP window scaling is enabled (default) to maximize throughput. WAN circuits have larger BDP values than LAN links.
WAN reports confirm that TCP congestion window fluctuates somewhere between 150-200KB per stream. TCP parallel streams (-P 4) is required to use all WAN bandwidth (92-94 Mbps) to hit near line rate throughput.
BDP example calculation for a typical enterprise WAN circuit:
BDP = 100 Mbps x 60ms RTT
= 100,000,000 bits x 0.060 sec
= 6,000,000 bits / 8 = 750,000 bytes (732KB)
200KB x 4 TCP streams = 800KB (saturation with 200KB congestion window)
Stop iPerf3 server (Ctrl + C)
clear command
TCP Download Throughput (client <- server)
This is a reverse mode test that measures throughput and retransmissions from server to client. Copy and paste this command to Ubuntu client then hit enter to start test.
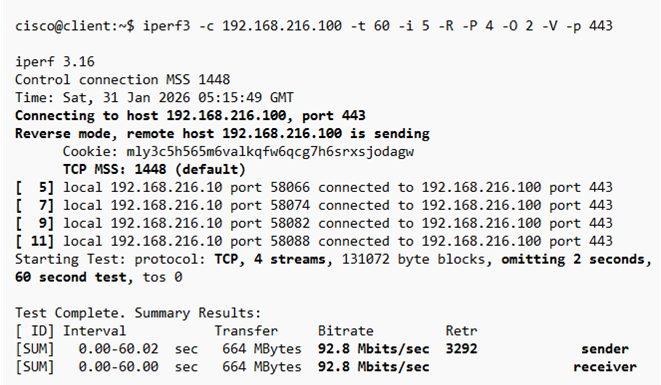
iperf3 -c 192.168.216.100 -t 60 -i 5 -R -P 4 -O 2 -V -p 443
iPerf3 Test Results
Download test results are very similar to upload results indicating the link is healthy and stable. TCP retransmissions of 0.68% for this test is lower than upload test and normal for WAN circuits. iPerf assigns an ID to each flow between client and server. This test assigned the same ID numbers that now represent server (sender) and client (receiver) since it is a reverse direction test.
Stop iPerf3 server (Ctrl + C)
clear command
Ethernet WAN Link Quality Testing
The purpose of link quality testing is to measure network health with baseline, saturation, and overload throughput conditions. iPerf tests how the network adapts to minimize packet loss and jitter when network congestion occurs. This includes queuing, buffering, contention, and CPU utilization. Cisco data plane limits, network bottlenecks, and asymmetric issues are also tested. QoS shaping/policing and L1/L2 errors such as duplex mismatch or MTU mismatch also affect real-world results. iPerf3 measures packet loss and jitter at the receiving node whether it is client or server.
*Stress and capacity testing should be done during less busy times and limited in duration or off-hours to minimize disruption. All other tests should be done during normal business hours for real-world results.
-b 90M is baseline speed to measure packet loss and jitter at near-capacity of link
-b 100M is saturation speed to measure packet loss and jitter at line rate capacity
-b 120M is overload congestion to test if QoS exists and how it enforces limits.
Upload Link Quality
This is testing upload direction for real-time applications (voice/video) to measure packet loss and jitter. There is baseline, saturation, and overload capacity testing. All UDP tests use nondefault UDP port 161 for real-world testing since packets sent to the internet will traverse a firewall. This avoids having to request a firewall rule since UDP 161 is typically allowed through firewalls.
Copy and paste the following command to Ubuntu server to start iPerf3 server with nondefault UDP port 161.
sudo iperf3 -s -p 161
Copy and paste each command shown to Ubuntu client separately to run individual tests. There is also –get-server-output option to display packet loss and jitter details measured at server receiving node.
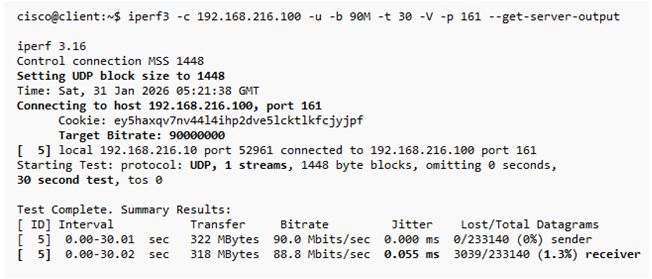
Baseline Test (90 Mbps)
iperf3 -c 192.168.216.100 -u -b 90M -t 30 -V -p 161 --get-server-output
iPerf3 Test Results
Test results for WAN packet loss (1.3%) is slightly higher than normal. This would start affecting voice and video traffic however data applications would not be degraded. WAN circuit normal packet loss is < 1% and jitter < 10ms.
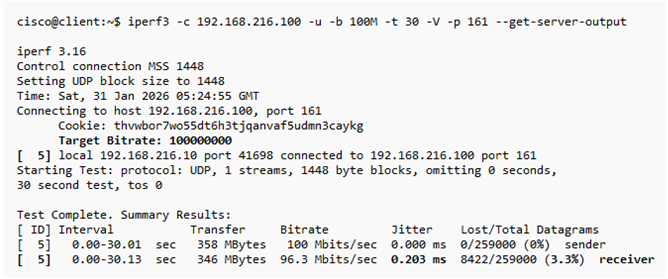
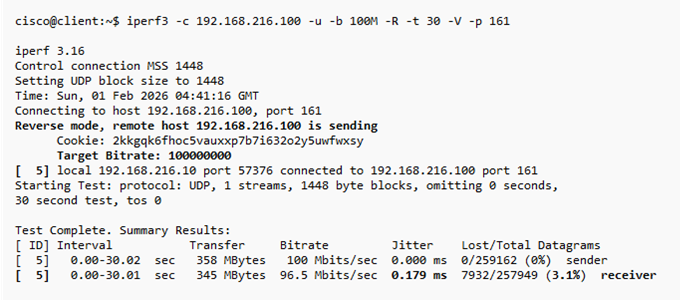
Saturation Test (100 Mbps)
iperf3 -c 192.168.216.100 -u -b 100M -t 30 -V -p 161 --get-server-output
iPerf3 Test Results
Saturation test results show a degraded network with 3% packet loss at line rate speed. This does not indicate a problem with network performance since some packet loss is expected at line rate throughput. The real-world analysis indicates there is adequate queuing with QoS shaping or rate-limiting deployed.
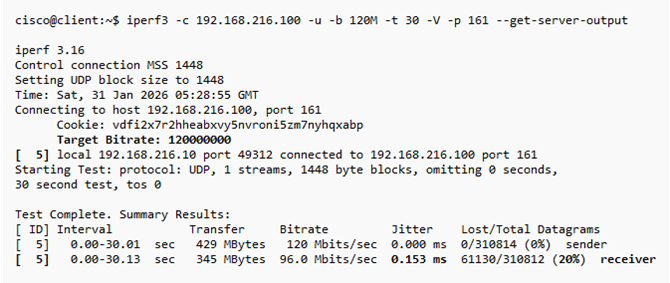
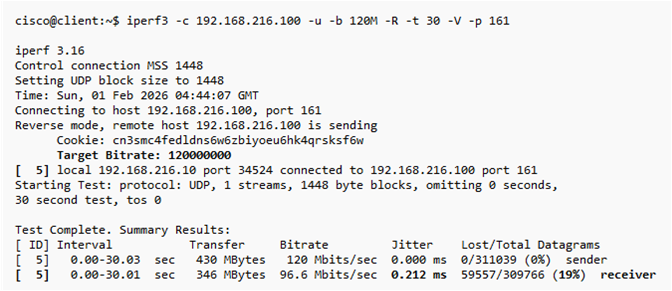
Overload Test (120 Mbps)
iperf3 -c 192.168.216.100 -u -b 120M -t 30 -V -p 161 --get-server-output
iPerf3 Test Results
Overload test results suggest there is shaping and queuing on the network to enforce Committed Information Rate (CIR). The packet loss of 20% is inline with going 20% over line rate speed of 100 Mbps. This is what an ISP would do to enforce CIR with customer or QoS within enterprise network. Overload test results confirm the network adapts quite well to stress testing. There is adequate network device and buffer capacity to prevent worsening network conditions.
Download Link Quality
This is testing download direction for real-time applications (voice/video) to measure packet loss and jitter. There is baseline, saturation, and overload capacity testing. Copy and paste each command to Ubuntu client separately to run individual tests.
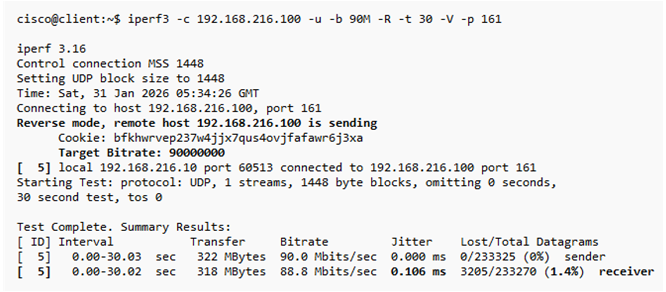
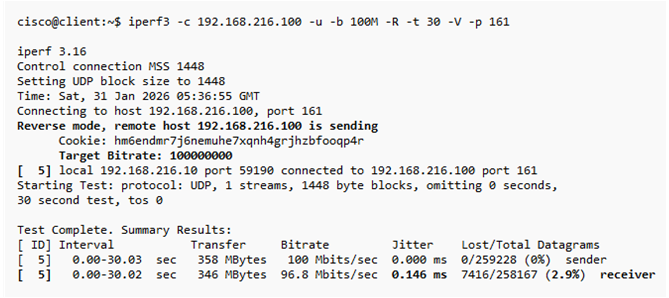
Baseline Test (90 Mbps)
iperf3 -c 192.168.216.100 -u -b 90M -R -t 30 -V -p 161
iPerf3 Test Results
Download test results were similar to upload test with 1.4% packet loss and low jitter. This would start affecting voice and video traffic however data applications would not be degraded. The results confirm performance is symmetric in forwarding and reverse path.
Saturation Test (100 Mbps)
iperf3 -c 192.168.216.100 -u -b 100M -R -t 30 -V -p 161
iPerf3 Test Results
Saturation test results show a degraded network with 2.9% packet loss at line rate speed. This does not indicate a problem with network performance since some packet loss is expected at baseline throughput. The real-world analysis indicates there is adequate queuing with QoS shaping or rate-limiting deployed similar to upload path.
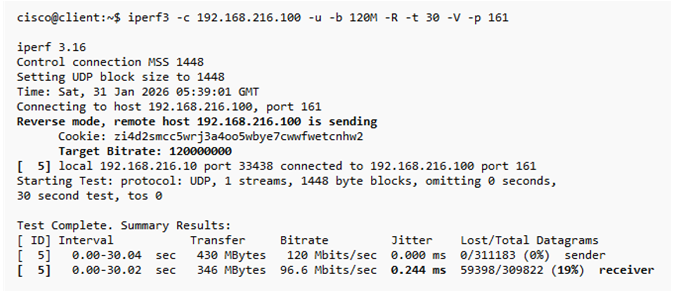
Overload Test (120 Mbps)
iperf3 -c 192.168.216.100 -u -b 120M -R -t 30 -V -p 161
iPerf3 Test Results
Overload test results suggest there is shaping and queuing on the network to enforce CIR. The packet loss of 19% is inline with going 20% over line rate speed of 100 Mbps. This is what an ISP would do to enforce CIR with customer.
Stop iPerf3 server (Ctrl + C)
clear command
ISP Broadband Testing (40/100)
This lab measures ISP throughput and speed of broadband (DSL, Cable, 5G) where download speed is higher than upload speed. This is referred to as asymmetric bandwidth and characteristic of broadband services. In this lab the upload speed is 40 Mbps and download speed is 100 Mbps. Data applications (TCP) send more data in the download direction and that accounts for higher broadband bandwidth.
Copy and paste the following commands on Ubuntu client to modify the WAN link conditions for broadband asymmetric bandwidth (40 Mbps).
sudo tc qdisc del dev ens2 root
sudo tc qdisc add dev ens2 root handle 1: tbf rate 40Mbit burst 256k latency 2ms
sudo tc qdisc add dev ens2 parent 1: handle 10: netem delay 2ms loss 0.7%
TCP Upload Throughput (40 Mbps)
This is a standard test that measures throughput (CIR) from client to server. Copy and paste this command to Ubuntu server to start iPerf server.
sudo iperf3 -s -p 443
Copy and paste this command to Ubuntu client then hit enter to start test.
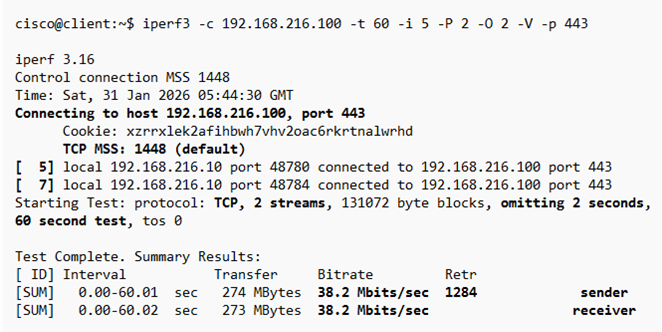
iperf3 -c 192.168.216.100 -t 60 -i 5 -P 2 -O 2 -V -p 443
iPerf3 Test Results
This test result is near line bitrate (38 Mbps) throughput for broadband circuit with CIR of 40 Mbps. TCP retransmissions should be less than 1% of data transfer (274 MB) for WAN connections. TCP retransmissions of 0.65% calculated for this test is within normal range for WAN performance.
Calculate percentage of TCP retransmissions based on data transfer (MB), default MSS (1448 bytes), and number of retransmissions.
TCP Retransmissions Percent Calculator
TCP Download Throughput (100 Mbps)
This is a reverse mode test that measures throughput (CIR) from client to server. Copy and paste this command to Ubuntu client then hit enter to start test.
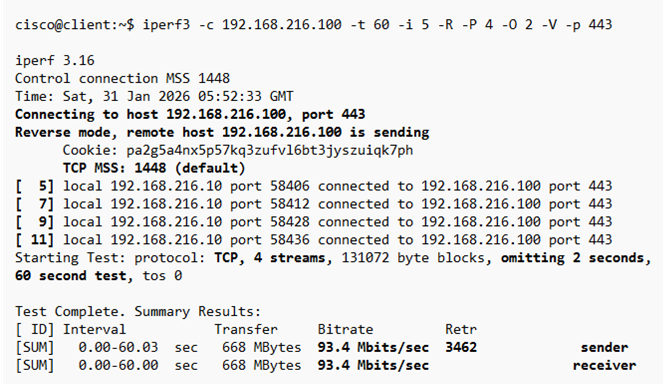
iperf3 -c 192.168.216.100 -t 60 -i 5 -R -P 4 -O 2 -V -p 443
iPerf3 Test Results
This test result is near line bitrate (93.4 Mbps) throughput for broadband circuit with download CIR of 100 Mbps. TCP retransmissions should be less than 1% of data transfer (668 MB) for WAN connections. TCP retransmissions of 0.72% calculated for this test is within normal range for WAN performance.
Stop iPerf3 server (Ctrl + C)
clear command
Broadband Link Quality Testing
This lab measures link quality of a broadband circuit to verify packet loss and jitter with UDP packets.
Upload Link Quality
This is testing upload direction for real-time applications (voice/video) to measure packet loss and jitter. There is baseline, saturation, and overload capacity testing. All UDP tests use nondefault port UDP 161 for real-world testing since packets sent to the internet will traverse a firewall.
Copy and paste the following command to Ubuntu server to start iPerf3 server with nondefault UDP port 161.
sudo iperf3 -s -p 161
Copy and paste each command to Ubuntu client separately to run individual tests.
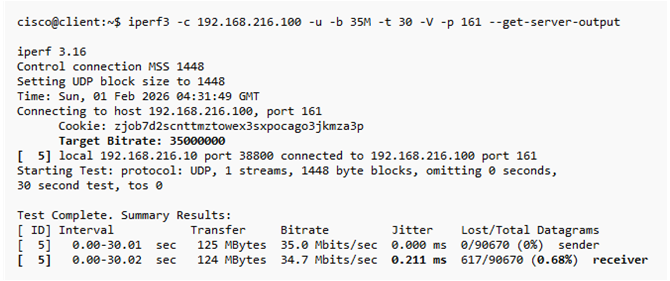
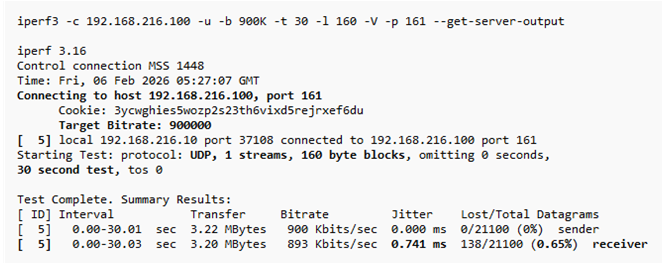
Baseline Test (35 Mbps)
iperf3 -c 192.168.216.100 -u -b 35M -t 30 -V -p 161 --get-server-output
iPerf3 Test Results
Test results for WAN packet loss (0.68%) is well within normal range and indicates a healthy circuit. WAN circuit normal packet loss should be is < 1% and jitter < 10ms.
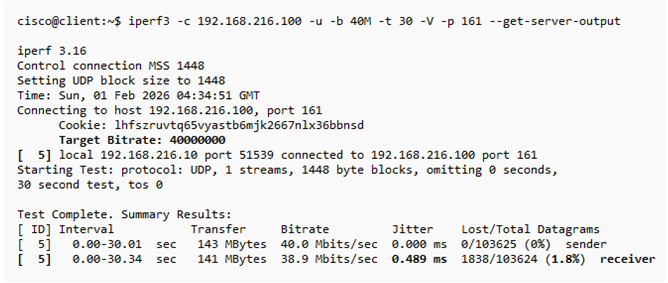
Saturation Test (40 Mbps)
iperf3 -c 192.168.216.100 -u -b 40M -t 30 -V -p 161 --get-server-output
iPerf3 Test Results
Saturation test results have packet loss at only 1.8%. This does not indicate a problem with network performance since some packet loss is expected at line rate throughput. Analysis indicates a network configured with optimal QoS shaping or rate-limiting and adequate hardware capacity (queues. buffers, CPU).
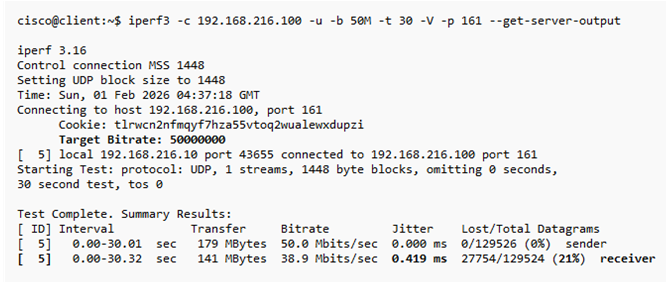
Overload Test (50 Mbps)
iperf3 -c 192.168.216.100 -u -b 50M -t 30 -V -p 161 --get-server-output
iPerf3 Test Results
Overload test results suggest there is shaping and queuing on the network to enforce Committed Information Rate (CIR). The packet loss of 21% is inline with going 20% over line rate speed of 100 Mbps. This is what an ISP would do to enforce CIR with customer or QoS within enterprise network. Overload test results confirm the network adapts quite well to stress testing. There is adequate network device and buffer capacity to prevent worsening network conditions.
Download Link Quality
This is testing download direction for real-time applications (voice/video) to measure packet loss and jitter. There is baseline, saturation, and overload capacity testing. Copy and paste each command to Ubuntu client separately to run individual tests.
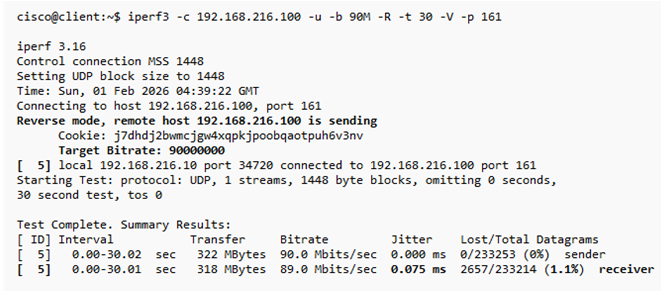
Baseline Test (90 Mbps)
iperf3 -c 192.168.216.100 -u -b 90M -R -t 30 -V -p 161
iPerf3 Test Results
Download test results were worse than upload test with 1.1% packet loss and low jitter. This would start affecting voice and video traffic however data applications would not be degraded. The results confirm some performance issues in reverse path to investigate.
Saturation Test (100 Mbps)
iperf3 -c 192.168.216.100 -u -b 100M -R -t 30 -V -p 161
iPerf3 Test Results
Saturation test results show a degraded network with 3.1% packet loss at line rate speed. This does not indicate a problem with network performance since some packet loss is expected at baseline throughput. The real-world analysis indicates there is adequate queuing with QoS shaping or rate-limiting deployed similar to upload path.
Overload Test (120 Mbps)
iperf3 -c 192.168.216.100 -u -b 120M -R -t 30 -V -p 161
iPerf3 Test Results
Overload test results suggest there is shaping and queuing on the network to enforce CIR. The packet loss of 19% is inline with going 20% over line rate speed of 100 Mbps. This is what an ISP would do to enforce customer CIR.
Stop iPerf3 server (Ctrl + C)
clear command
Copy and paste the following commands on Ubuntu client to reset the WAN link conditions for symmetric bandwidth.
clear
sudo tc qdisc del dev ens2 root
sudo tc qdisc add dev ens2 root handle 1: tbf rate 100Mbit burst 256k latency 2ms
sudo tc qdisc add dev ens2 parent 1: handle 10: netem delay 2ms loss 0.7%
Lab 2: Voice Traffic Testing
iPerf3 is used to validate link quality for voice traffic within the enterprise network. Voice traffic is bidirectional since there are separate flows (sockets) per call from client to server and vice versa. This lab measures link quality for G.711 (no compression) and G.729 voice compression. The recommended packet loss should be less than 1% and jitter less than 30ms for each direction.
Throughput calculation for G.711 testing explains payload (-l 160) and bandwidth (-b 900K) configuration for 10 voice calls.
Per-call calculation:
Codec: G.711 (64 kbps)
Packetization: 20 ms → 50 packets/sec
Payload per packet: 160 bytes (-l 160)
Headers: RTP (12 bytes) + UDP (8 bytes) + IP (20 bytes) + Ethernet (18 bytes) = 58 bytes
Total packet size: 160 + 58 = 218 bytes
Per-call bandwidth: 218 × 8 × 50 = 87,200 bps ≈ 90 kbps
Aggregate bandwidth:
10 calls: 10 × 90 kbps ≈ 900 kbps (-b 900K)
G.711 Upload Link Quality – 10 Voice Calls
Copy and paste the following command to Ubuntu server to start iPerf3 server with nondefault UDP port 161.
sudo iperf3 -s -p 161
Copy and paste the following command to Ubuntu client to start upload test.
iperf3 -c 192.168.216.100 -u -b 900K -t 30 -l 160 -V -p 161 --get-server-output
iPerf3 Test Results
Link quality for voice traffic is acceptable with less than 1% packet loss (0.65%) and low jitter for upload path.
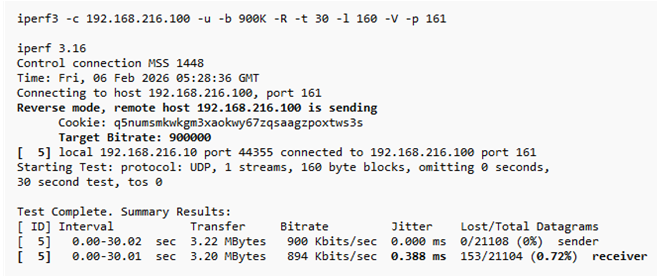
G.711 Download Link Quality – 10 Voice Calls
Copy and paste the following command to Ubuntu client to start download test.
iperf3 -c 192.168.216.100 -u -b 900K -R -t 30 -l 160 -V -p 161
iPerf3 Test Results
Link quality for voice traffic is acceptable with less than 1% packet loss (0.72%) and low jitter for download path. This confirms upload and download path are symmetric for link quality.
G.729 Upload Link Quality – 10 Voice Calls
Copy and paste the following command to Ubuntu client to start upload test.
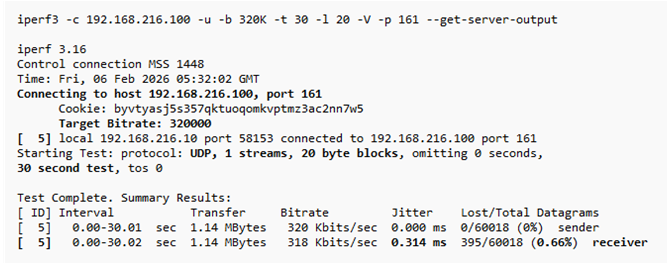
iperf3 -c 192.168.216.100 -u -b 320K -t 30 -l 20 -V -p 161 --get-server-output
Throughput calculation for G.729 testing explains payload (-l 20) and bandwidth (-b 320K) configuration for 10 voice calls. G.729 is deployed to WAN where bandwidth is limited since it provides voice compression.
Per-call calculation:
Codec: G.729 (8 kbps)
Packetization: 20 ms → 50 packets/sec
Payload per packet: 20 bytes (-l 20)
Headers: RTP (12 bytes) + UDP (8 bytes) + IP (20 bytes) + Ethernet (18 bytes) = 58 bytes
Total packet size: 20 + 58 = 78 bytes
Per-call bandwidth: 78 × 8 × 50 = 31,200 bps ≈ 32 kbps
Aggregate bandwidth for 10 calls:
10 × 32 kbps ≈ 320 kbps (-b 320K)
iPerf3 Test Results
Link quality for voice traffic is acceptable with less than 1% packet loss (0.66%) and low jitter for upload path.
G.729 Download Link Quality – 10 Voice Calls
Copy and paste the following command to Ubuntu client to start download test.
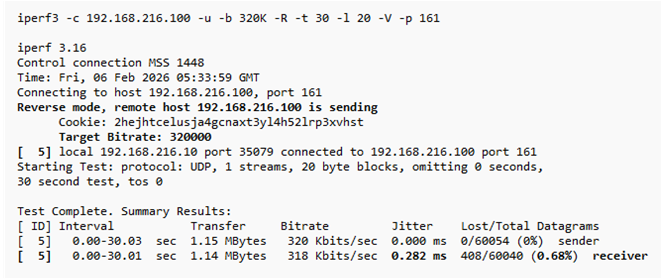
iperf3 -c 192.168.216.100 -u -b 320K -R -t 30 -l 20 -V -p 161
iPerf3 Test Results
Link quality for voice traffic is acceptable with less than 1% packet loss (0.68%) and low jitter for download path.
Stop iPerf3 server (Ctrl + C)
clear command
Lab 3: Video Traffic
iPerf3 is used to verify link quality for streaming and video conferencing traffic.
Streaming Video Download Throughput – Single Stream
Standard video streaming is TCP-based with traffic in download direction only from server to client. Common examples include HD video streaming (5 Mbps) from Youtube and Netflix.
Copy and paste the following command to Ubuntu server to start iPerf3 server with nondefault TCP port 443.
sudo iperf3 -s -p 443
Copy and paste the following command to Ubuntu client to start download test.
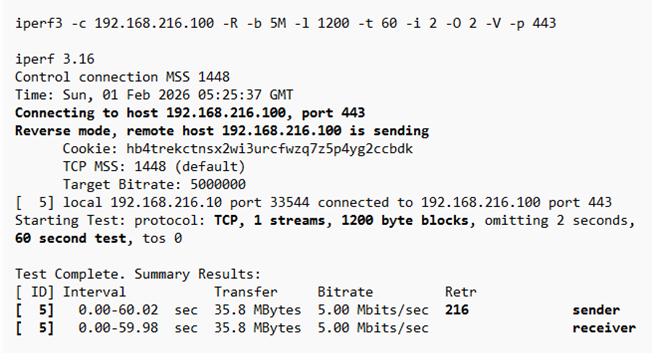
iperf3 -c 192.168.216.100 -R -b 5M -l 1200 -t 60 -i 2 -O 2 -V -p 443
iPerf3 Test Results
Throughput is shaped to 5 Mbps for this test to simulate a single video stream. The most important metric is TCP retransmissions that measures network health. There was 216 retransmissions from 35.8 MB of data transfer. TCP retransmissions calculator was used to calculate there was 0.83% retransmissions. This is well within normal range for video streaming that can tolerate up to 2% packet loss since it is not real-time video.
Video streaming can tolerate more packet loss than video conferencing since it is TCP-based. Any packet loss is mitigated with TCP retransmission to minimize packet loss. There is buffering as well that can mitigate temporary degraded network conditions.
Streaming Video Download Throughput – 10 Streams
Copy and paste the following command to Ubuntu client to start download test.
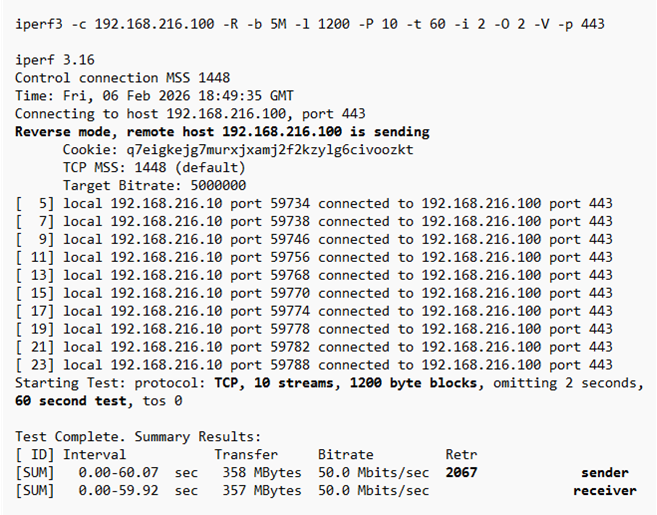
iperf3 -c 192.168.216.100 -R -b 5M -l 1200 -P 10 -t 60 -i 2 -O 2 -p 443
iPerf3 Test Results
TCP parallel streams were used to simulate 10 video calls with each shaped to 5 Mbps for simulating video streams. The most important metric is TCP retransmissions that measures network health. There was 2067 retransmissions from 358 MB of data transfer. TCP retransmissions calculator was used to calculate there was 0.80% retransmissions. Based on test results, network link quality is acceptable for at least 10 calls and practically for much more than that. It is recommended to run baseline tests several times during the day to confirm link quality as network conditions could change.
Stop iPerf3 server (Ctrl + C)
clear command
Video Conferencing Full Duplex Throughput – Single Stream
Standard video conferencing is UDP-based bidirectional traffic (2 Mbps) between client and server. Common examples include Microsoft Teams, Zoom and Cisco Webex.
Copy and paste the following command to Ubuntu server to start iPerf3 server with nondefault UDP port 161.
sudo iperf3 -s -p 161
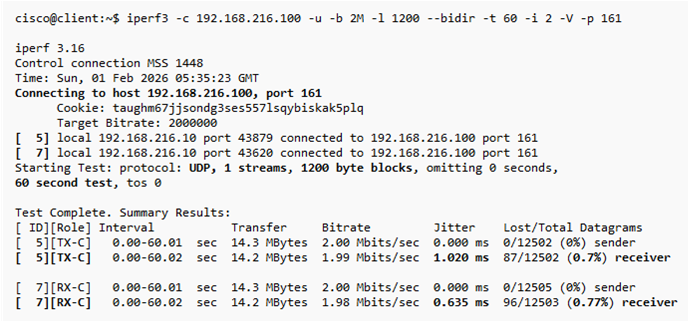
Copy and paste the following command to Ubuntu client to start bidirectional test.
iperf3 -c 192.168.216.100 -u -b 2M -l 1200 –bidir -t 60 -i 2 -V -p 161
iPerf3 Test Results
This is bidirectional testing since video conferencing sends streams simultaneously in both directions. Link quality testing is done to measure packet loss and jitter at receiving node only. The result for single stream test indicate a healthy network with 0.7% packet loss and low jitter.
Video Conferencing Full Duplex Throughput – 5 Streams
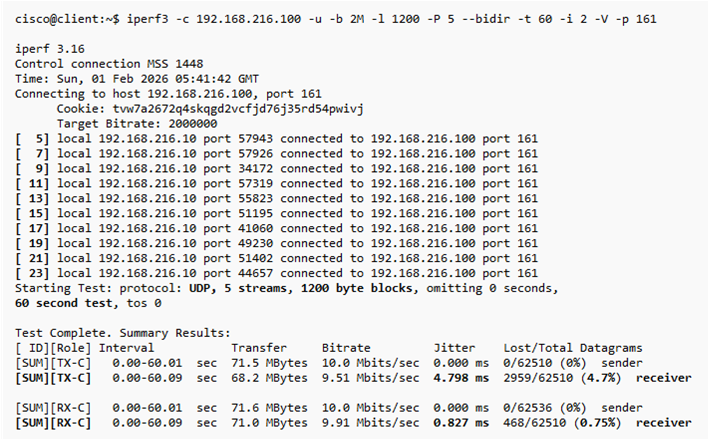
Copy and paste the following command to Ubuntu client to start bidirectional test.
iperf3 -c 192.168.216.100 -u -b 2M -l 1200 -P 5 –bidir -t 60 -i 2 -V -p 161
iPerf3 Test Results
This test simulates 5 video conferencing streams (-P 5) to test video link quality with higher throughput. The results indicate a problem in upload path from client to server since packet loss is 4.7%. The server is receiver for that flow [TX-C] where packet loss is detected. UDP is connectionless and discards packets instead of attempting retransmission. Video conferencing traffic is real-time and starts to degrade when packet loss is 1%. There could be some QoS misconfiguration or hardware issues causing packet loss. It is recommended to run baseline tests several times during the day to confirm link quality as network conditions could change.
Stop iPerf3 server (Ctrl + C)
clear command
Lab 4: VoIP QoS Validation
The purpose of this lab is to verify that voice QoS is working correctly. The test sends a stream of data traffic over 100 Mbps to cause network congestion. Voice packets are sent in a second stream with DSCP EF marking to verify QoS is enabled. Since voice is bidirectional, there is an upload and download test to verify path in both directions. Read through the instructions first before starting tests and open each Ubuntu console window.
Voice QoS Upload Path Validation
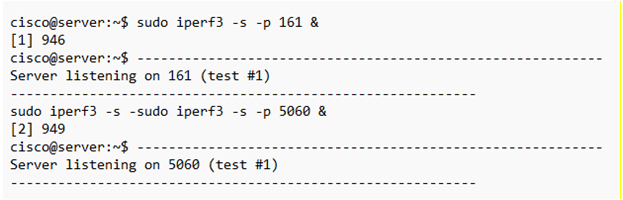
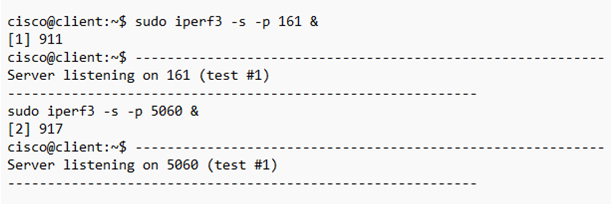
Start two iperf3 processes on Ubuntu server with different UDP listening ports for data (161) and voice traffic (5060).
clear
sudo iperf3 -s -p 161 &
sudo iperf3 -s -p 5060 &
Open Windows PowerShell from start menu and SSH into Ubuntu client.
ssh cisco@192.168.216.10
password: cisco
This command will create network congestion by sending data traffic from client to server over line rate at 110 Mbps. Paste this command into Windows PowerShell and hit enter.
iperf3 -c 192.168.216.100 -u -b 110M -t 50 --dscp 0 -p 161
Switch to Ubuntu client main window immediately and paste this command then hit enter. This command will send simulated voice packets with EF marking to server.
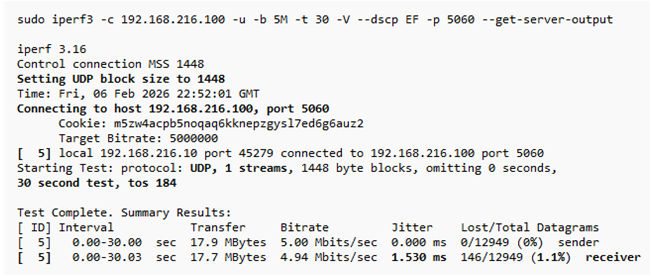
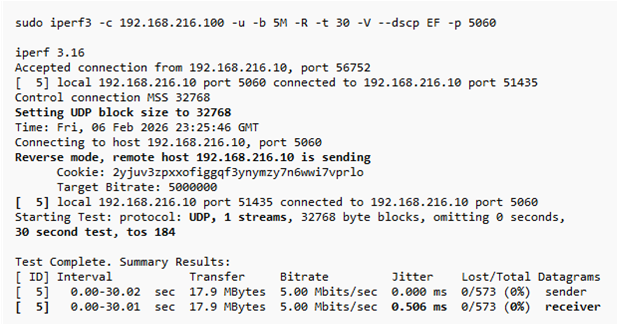
sudo iperf3 -c 192.168.216.100 -u -b 5M -t 30 -V --dscp EF -p 5060 --get-server-output
iPerf3 Test Results
The upload test measured packet loss of 1.1% that would cause some noticeable degraded voice service. This suggests there could be a problem with QoS configuration and voice priority queuing.
Switch to Ubuntu server console and stop UDP listening ports 161 and 5060.
Ctrl + C (stop iPerf3 server processes)
clear command
sudo pkill iperf3
jobs (confirm no processes running)
VoIP QoS Download Path Validation
Start two iperf3 processes on Ubuntu client with different UDP listening ports for data (161) and voice traffic (5060).
clear
sudo iperf3 -s -p 161 &
sudo iperf3 -s -p 5060 &
Switch to Windows PowerShell and exit from client session then SSH to Ubuntu server.
clear
exit
ssh cisco@192.168.216.100
password: cisco
This command will create network congestion sending data traffic from server to client (download). Paste this command into Windows PowerShell and hit enter.
sleep 10; iperf3 -c 192.168.216.10 -u -b 110M -t 50 --dscp 0 -p 161
Switch to Ubuntu client console window immediately and paste this command then hit enter. This command sends simulated voice packets with EF marking to client (reverse direction). Linux sudo privilege is required to set DSCP marking for iPerf3 test.
sudo iperf3 -c 192.168.216.10 -u -b 5M -R -t 30 -V --dscp EF -p 5060
iPerf3 Test Results
The download test measured no packet loss for voice packets. This confirms that QoS configuration and voice priority queuing is working correctly in download path.
Switch to Ubuntu client console and stop UDP listening ports 161 and 5060.
Ctrl + C (stop iPerf3 processes)
clear command
sudo pkill iperf3
jobs (confirm no processes running)
Lab 5: MTU Mismatch
This is a classic network error when VPN tunnel is assigned lower MTU and fragmentation occurs or packet drops if PMTUD is not working. This lab configures a lower MTU size on Ubuntu server to simulate a VPN tunnel MTU mismatch.
Configure lower MTU value on Ubuntu server so that fragmentation will be required from client sending packets with larger MTU 1500 bytes.
sudo ip link set dev ens2 mtu 1400
Copy and paste this command to start iPerf3 server on Ubuntu server.
sudo iperf3 -s -p 161
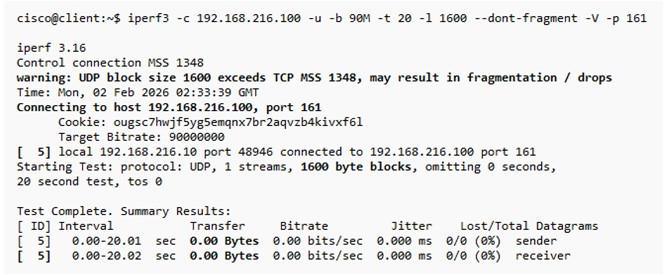
Send packets from Ubuntu client with larger MSS 1600 and DF bit set to verify 100% packet loss.
iperf3 -c 192.168.216.100 -u -b 90M -t 20 -l 1600 --dont-fragment -V -p 161
iPerf3 Test Results
This test confirms that all packets are dropped when an ISP disables PMTUD and has DF bit set. This is less common today although MTU mismatch is still an issue that causes fragmentation at ISP routers. The result is higher latency, queuing, and sometimes packet loss when routers are busy. You will have slow application performance and bulk transfers for example that take longer. Test for MTU mismatch with ping command and dont fragment (DF) bit set. VPN tunnel with MTU 1400 will have to fragment packets and you will get an error that DF bit is set and ping fails. Replace google.com with an IP address or hostname to test a different path with VPN tunnel.
ping google.com -f -l 1472 # Windows ping command with dont fragment bit set
ping -M do -s 1472 google.com # Linux ping command with dont fragment bit set
Stop iPerf3 server (Ctrl + C)
clear command
Configure default MTU 1500 bytes setting on Ubuntu server to prevent fragmentation.
sudo ip link set dev ens2 mtu 1500
Lab 6: Server Disk Read/Write Throughput
This host-based test will create a 200 MB file on Ubuntu server using dd and read the test file from server disk to the network using reverse mode. Server disk latency is a common bottleneck that can add significant latency to applications. It is important to identify whether network latency or server processing delay is a performance bottleneck.
Disk Read Throughput
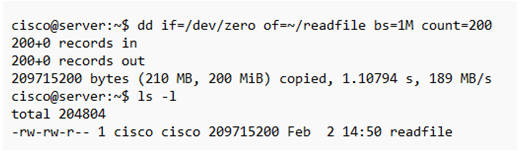
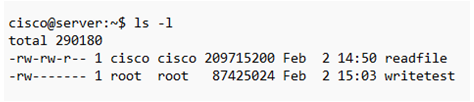
Create 200MB test file on Ubuntu server with the following command and start iPerf3 server.
dd if=/dev/zero of=~/readfile bs=1M count=200
sudo iperf3 -s -p 443
Copy and paste this command on Ubuntu client to start reverse mode test that will copy readfile from server to client.
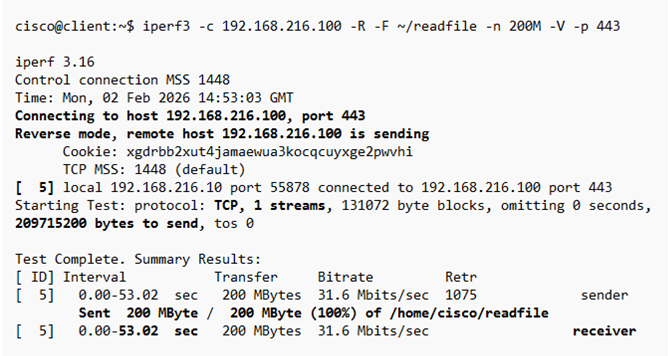
sudo iperf3 -c 192.168.216.100 -R -F ~/readfile -n 200M -V -p 443
iPerf3 Test Results
The most important result for this read test is test duration or amount of time to transfer 200 MB file from server to client. In this example the file download took 53 seconds to complete with a bitrate of 31.6 Mbps. TCP-based tests use all bandwidth available and are only constrained by network conditions.
Memory-to-Memory Test
Run this default memory-to-memory test to compare throughput (bitrate) and amount of time required to copy the same 200MB data transfer. The difference in download time is the server disk read bottleneck,
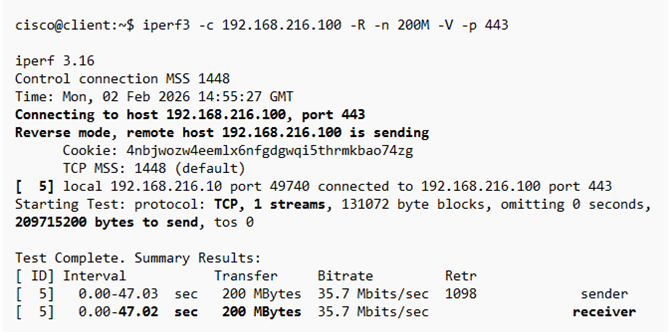
iperf3 -c 192.168.216.100 -R -n 200M -V -p 443
iPerf3 Test Results
The results of this test confirm that memory-to-memory is 6 seconds faster (47 seconds) than disk access test for sending the same 200 MB data transfer. Average throughput for this test is higher (35.7 Mbps) than disk read test. The server disk read access bottleneck causes higher latency and slower response time. This issue worsens when the server is busy and reason to deploy low-latency hard disks on server.
Stop iPerf3 server (Ctrl + C)
clear command
Disk Write Throughput
This host-based test will create a file called writetest on Ubuntu server from the arriving network traffic and write to server disk. The server disk write adds more latency causing lower data transfer and average connection speed.
Copy and paste this command to Ubuntu server that will create a file using inbound packets from Ubuntu client.
sudo iperf3 -s -F writetest -p 443
Copy and paste this command to Ubuntu client that will start test and send packets to Ubuntu server. The data transfer size (MB) sent to Ubuntu server will be compared with results of a standard iPerf memory-to-memory test.
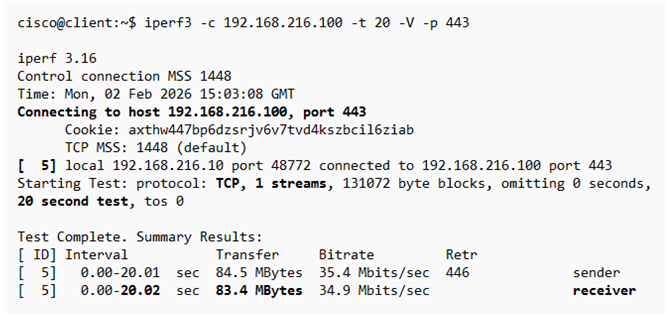
iperf3 -c 192.168.216.100 -t 20 -V -p 443
iPerf3 Test Results
The disk write test sent packets from client to server for 20 seconds and transferred 83.4 MB to server. This data was used to write a file on server to measure disk write latency effect.
Stop iPerf3 server (Ctrl + C)
clear
Memory-to-Memory Test
Compare results from a standard TCP throughput test for 20 seconds duration. There is more data sent to server compared with disk write test for the same 20 seconds. The server disk write bottleneck causes more latency and lower data transfer.
Copy and paste this command to start iPerf server.
sudo iperf3 -s -p 443
Copy and paste the following command to Ubuntu client to start test.
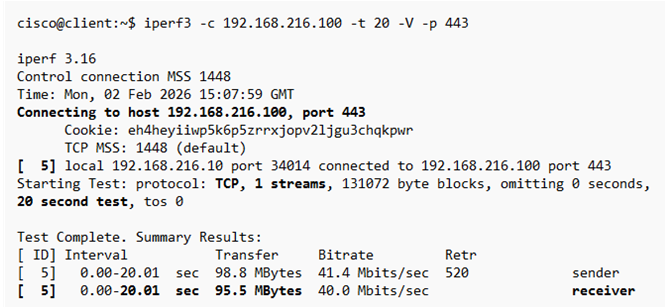
iperf3 -c 192.168.216.100 -t 20 -V -p 443
iPerf3 Test Results
The results of this test confirm that memory-to-memory sent 95.5 MB of data for the same 20 seconds. That is an additional 12.1 MB of data sent to server and confirms server disk write access is a bottleneck. The disk bottleneck causes higher latency and slower response time. This issue worsens when the server is busy and reason to deploy low-latency hard disks on server.
Stop iPerf3 server (Ctrl + C)
clear